上游充通大¥ e SHANGHAI JIAO TONG UNIVERSITY Chapter 9.Phase Diagram Ill Review: 是 Immiscibility:不溶性 Spinodal Points:拐点 Peritectic Phase diagram:包晶相图 Compounds:化合物 LV0VY7 AI JIAO TONG UNIV
Chapter 9. Phase Diagram III Review: Immiscibility: 不溶性 Spinodal Points:拐点 Peritectic Phase diagram:包晶相图 Compounds:化合物
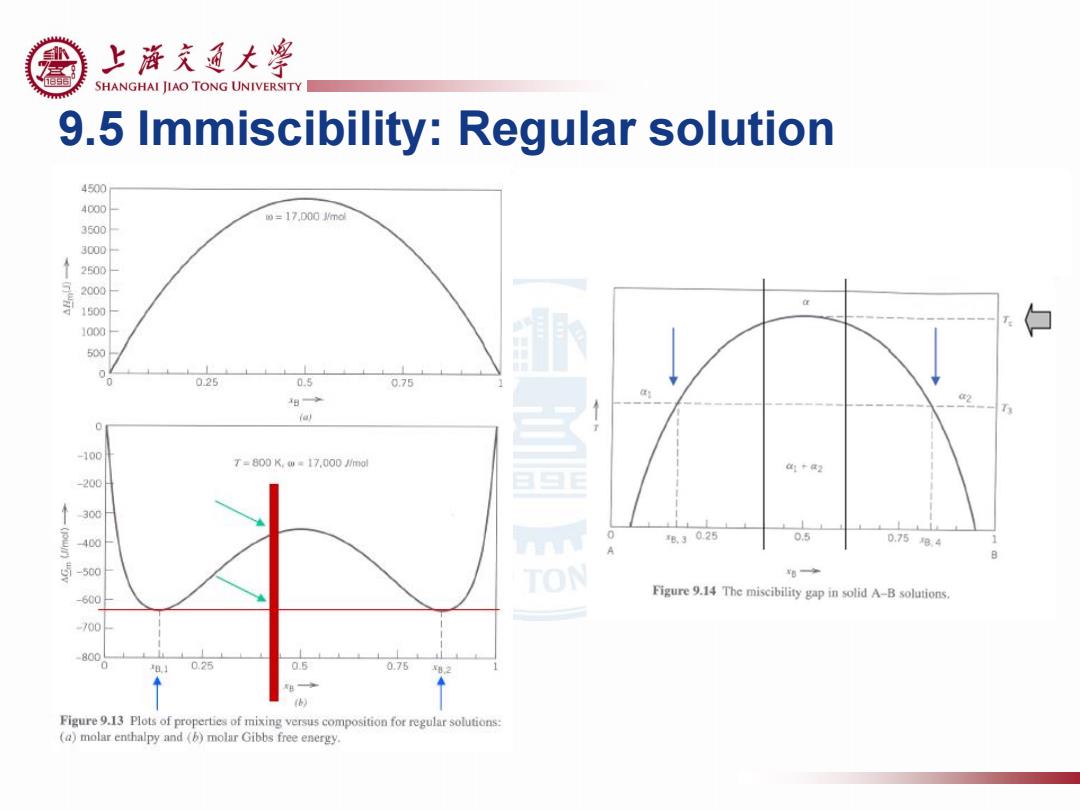
上游充通大¥ SHANGHAI JIAO TONG UNIVERSITY 9.5 Immiscibility:Regular solution 4500 4000 m=17.D00md 3500 3000 2500 2000 1500 1000 白 500 025 0.5 0.75 8◆ ia) -100 T=800K,w=17.000imdl 1+2 200 300 400 ®3025 0.5 0.758.4 1 -500 TON u◆ 600 Figure 9.14 The miscibility gap in solid A-B solutions. 700 800 0.25 0.75 Figure 9.13 Plots of properties of mixing versus composition for regular solutions: (a)molar enthalpy and (b)molar Gibbs free energy
9.5 Immiscibility: Regular solution

上游充通大粤 SHANGHAI JIAO TONG UNIVERSITY 9.6 Spinodal points 1050 1000 line 750 0 -100 600 T=800K,w=17.000 J/mol 0.25 0.5 075 -200 The decomposition here will cause the increase of Gibbs free energy Figure 9.15 The miscibility gap,showing spinodal line. 300 and therefore is relatively not favored -400 -500 △Gm decrease upon decomposition -600 -700 △Gm increase upon decomposition -80 0 xB.1 0.25 0.5 0.75 XB,2 x8→
9.6 Spinodal points
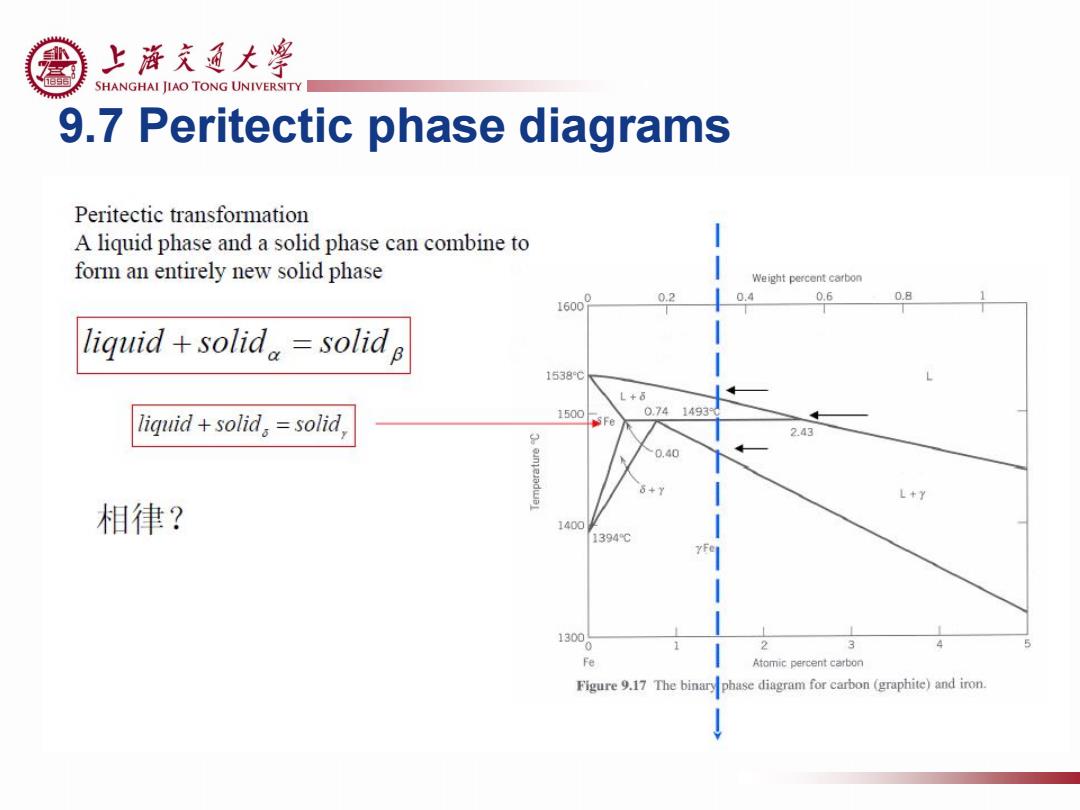
上游充通大粤 SHANGHAI JIAO TONG UNIVERSITY 9.7 Peritectic phase diagrams Peritectic transformation A liquid phase and a solid phase can combine to form an entirely new solid phase Weight percent carbon 02 0.4 0.6 0.8 liquid +solid,=solid B 1538℃ L+6 0.741493 liquid +solid,=solid 1500 Fe 2.43 0.40 6+y L+7 相律? 1400 1394℃ 1300 2 Fe Atomic percent carbon Figure 9.17 The binary phase diagram for carbon (graphite)and iron
9.7 Peritectic phase diagrams
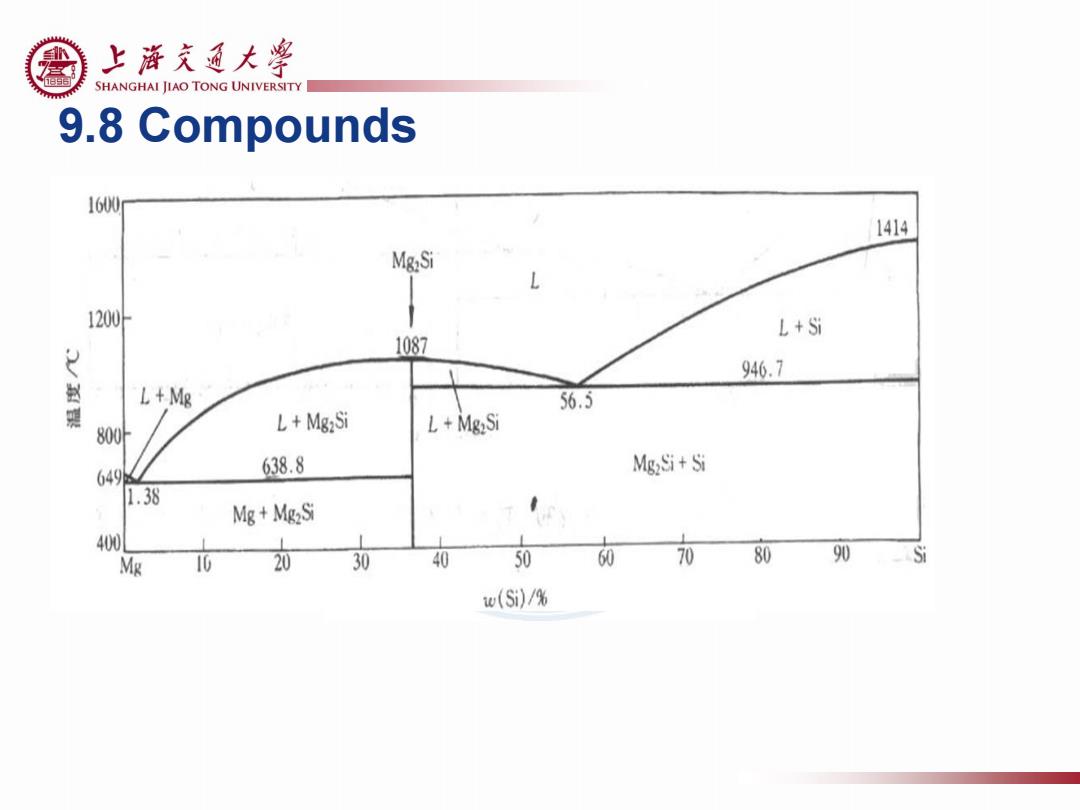
上游充通大¥ SHANGHAI JIAO TONG UNIVERSITY 9.8 Compounds 1600 1414 Mg:Si L 1200 L+Si 1087 946.7 赵 L+Mg 56.5 800 L+Mg2Si L+MgzSi 649 638.8 Mg2Si+Si 1.38 Mg+Mg2Si 400 Mg 10 20 30 40 50 60 70 80 90 Si w(Si)/%
9.8 Compounds
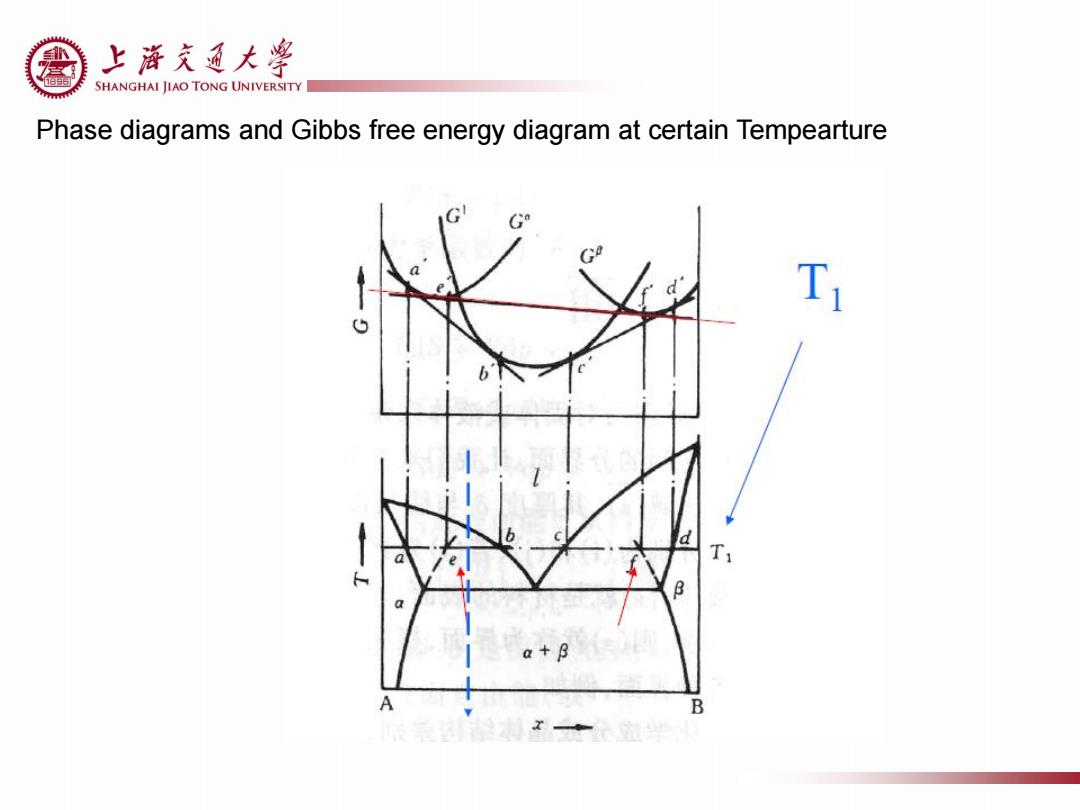
上游充通大¥ SHANGHAI JIAO TONG UNIVERSITY Phase diagrams and Gibbs free energy diagram at certain Tempearture T 8 a+B A B
Phase diagrams and Gibbs free energy diagram at certain Tempearture
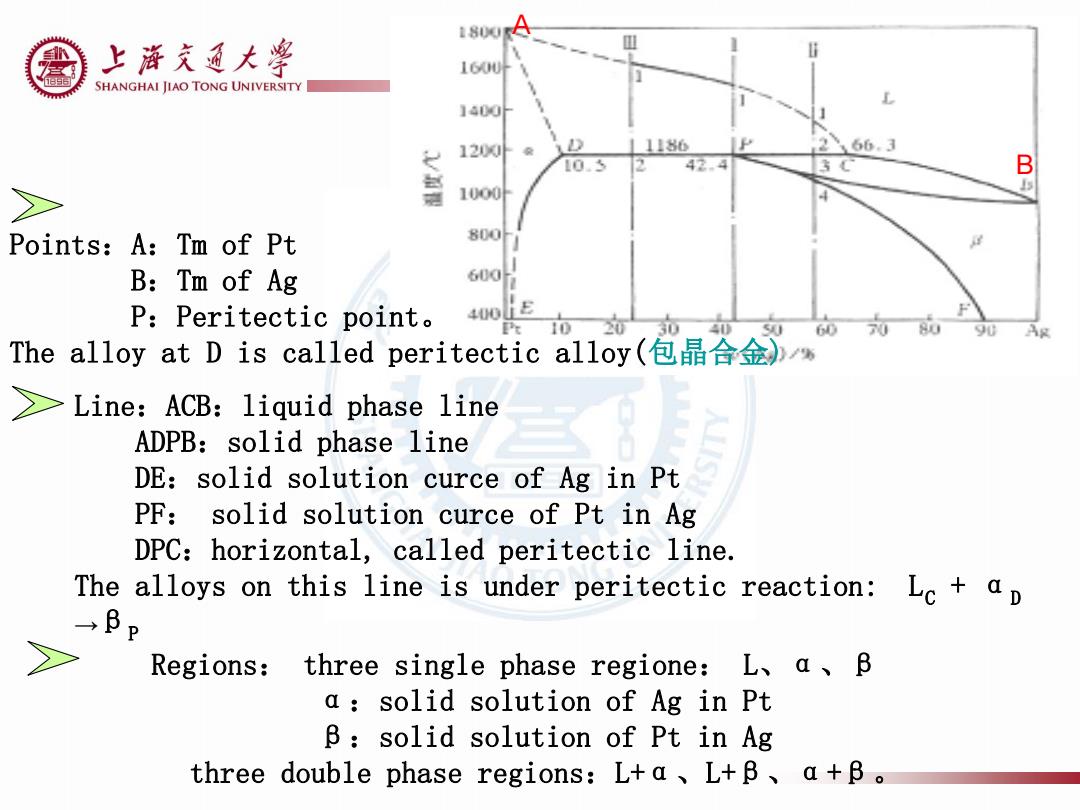
上游充通大¥ 160U片 SHANGHAI JIAO TONG UNIVERSITY 1400h 1200外 11186 266.3 10.5 42. B 包 1000 Points: A:Tm of Pt 800 B:Tm of Ag P:Peritectic point。 400LE 3 60 The alloy at D is called peritectic alloy(包晶合金)% >Line:ACB:liquid phase line ADPB:solid phase line DE:solid solution curce of Ag in Pt PF:solid solution curce of Pt in Ag DPC:horizontal,called peritectic line. The alloys on this line is under peritectic reaction:Lc ap →BP Regions:three single phase regione:L、a、B a:solid solution of Ag in Pt B:solid solution of Pt in Ag three double phase regions:L+a、L+B、a+B
A Points:A:Tm of Pt B:Tm of Ag P:Peritectic point。 The alloy at D is called peritectic alloy(包晶合金) Line:ACB:liquid phase line ADPB:solid phase line DE:solid solution curce of Ag in Pt PF: solid solution curce of Pt in Ag DPC:horizontal, called peritectic line. The alloys on this line is under peritectic reaction: LC + αD →βP Regions: three single phase regione: L、α、β α:solid solution of Ag in Pt β:solid solution of Pt in Ag three double phase regions:L+α、L+β、α+β。 B
上游充通大¥ SHANGHAI JIAO TONG UNIVERSITY Usage of phase diagrams 1 ith multi-components syster -phase rule -Phase diagrams: 1.equilibrium phases under different conditions 2.What will happen to the phases while the Temp,pressure and/or composition changes 3.The conditions for phase transformation To investigate new materials Critical evidence to analyze the alloy components,chemical composition, and to design the manufacturing and thermal treatment process
Usage of phase diagrams 1 To deal with multi-components system -phase rule -Phase diagrams: 1.equilibrium phases under different conditions 2.What will happen to the phases while the Temp, pressure and/or composition changes 3.The conditions for phase transformation To investigate new materials Critical evidence to analyze the alloy components, chemical composition, and to design the manufacturing and thermal treatment process
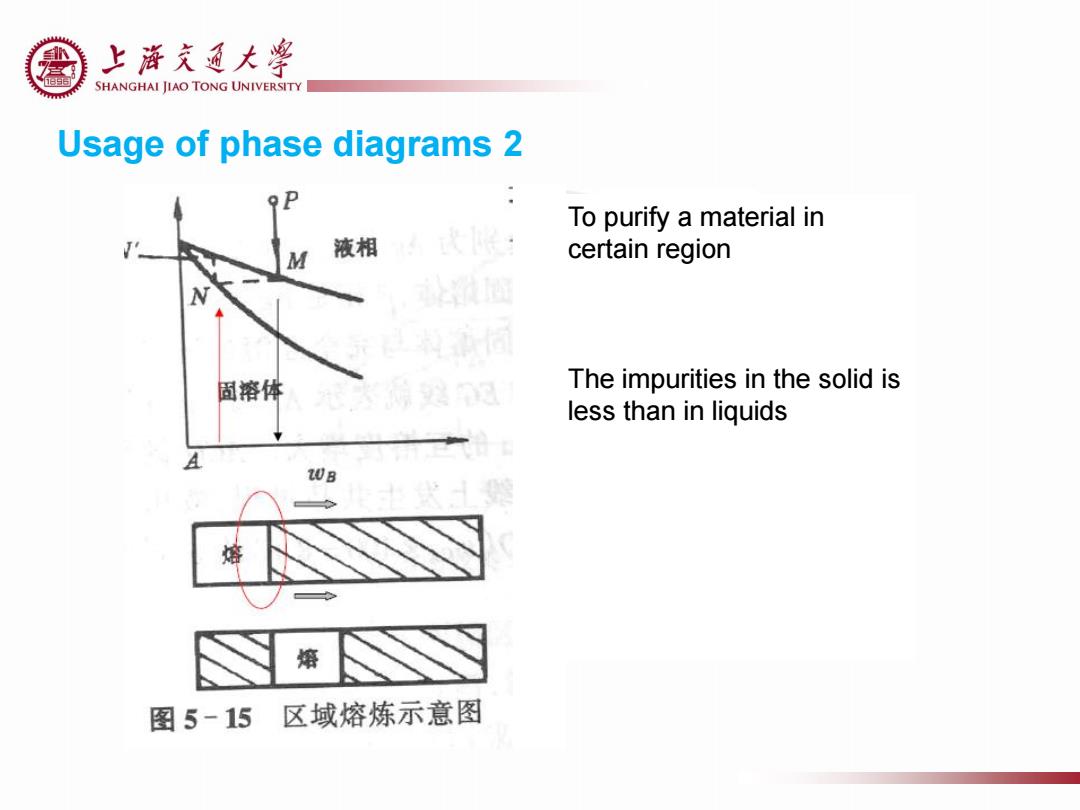
上游充通大¥ SHANGHAI JIAO TONG UNIVERSITY Usage of phase diagrams 2 To purify a material in M 液相 certain region 固溶体 The impurities in the solid is less than in liquids 20B 熔 熔 图5-15区域熔炼示意图
Usage of phase diagrams 2 To purify a material in certain region The impurities in the solid is less than in liquids
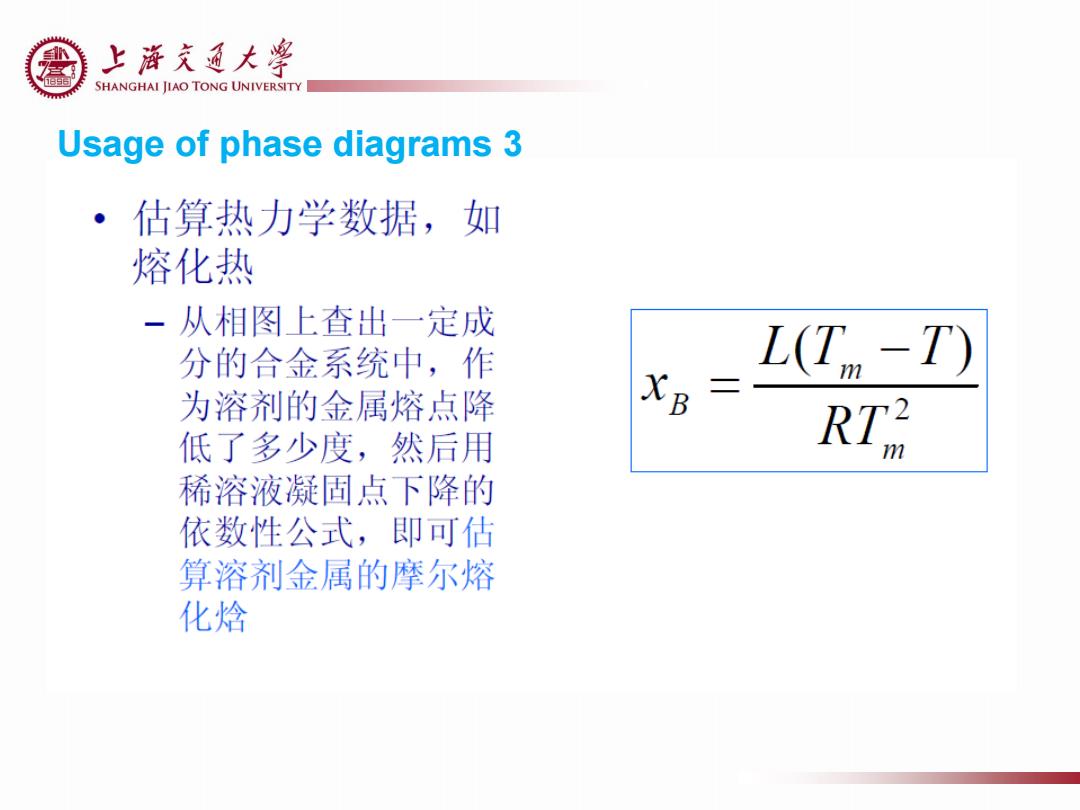
上游充通大¥ SHANGHAI JIAO TONG UNIVERSITY Usage of phase diagrams 3 估算热力学数据,如 熔化热 一从相图上查出一定成 分的合金系统中,作 LT-T) 为溶剂的金属熔点降 XB= 低了多少度,然后用 RTR 稀溶液凝固点下降的 依数性公式,即可估 算溶剂金属的摩尔熔 化焓
Usage of phase diagrams 3