上游充通大粤 SHANGHAI JIAO TONG UNIVERSITY Chapter 9.Phase Diagram Ill Review: 是 Immiscibility:不溶性 Spinodal Points:拐点 Peritectic Phase diagram:包晶相图 Compounds:化合物 AIJIAO TONG UNIVE A Peng Zhang NoV25,2016
Chapter 9. Phase Diagram III Review: Immiscibility: 不溶性 Spinodal Points:拐点 Peritectic Phase diagram:包晶相图 Compounds:化合物 1 Peng Zhang Nov 25, 2016
上游充通大粤 SHANGHAI JIAO TONG UNIVERSITY Phase diagrams and Gibbs free energy diagram at certain Tempearture G G T a+8 A B 2
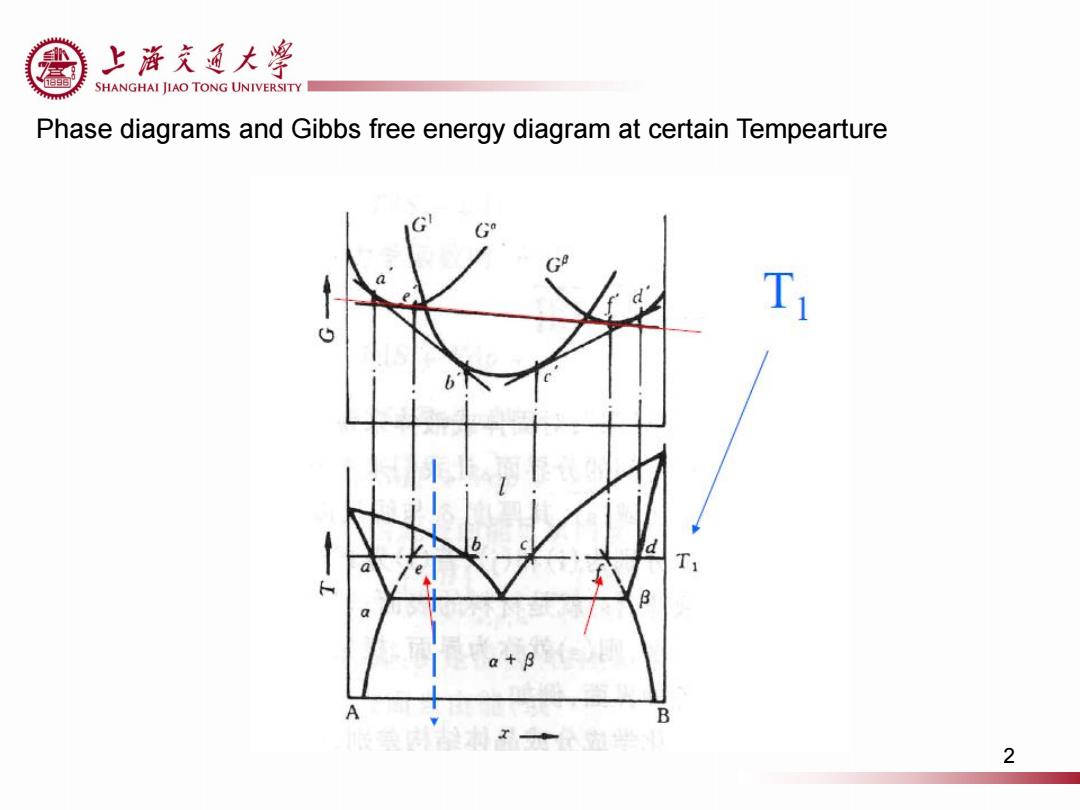
Phase diagrams and Gibbs free energy diagram at certain Tempearture 2
上游克通大学 SHANGHAI JIAO TONG UNIVERSITY 9.5 Immiscibility:Regular solution 4500 4000 m=17,D00md 3500 3000 2500 2000 1500 1000 白 500 025 0.5 0.75 出 ia) 0 -100 T=800K.w=17.000/m0 1t2 200 300 400 ®3025 0.5 0.758.4 1 -500 TON 想◆ -600 Figure 9.14 The miscibility gap in solid A-B solutions. 700 800 0.25 0.75 Figure 9.13 Plots of properties of mixing versus composition for regular solutions: (a)molar enthalpy and (b)molar Gibbs free energy. 3
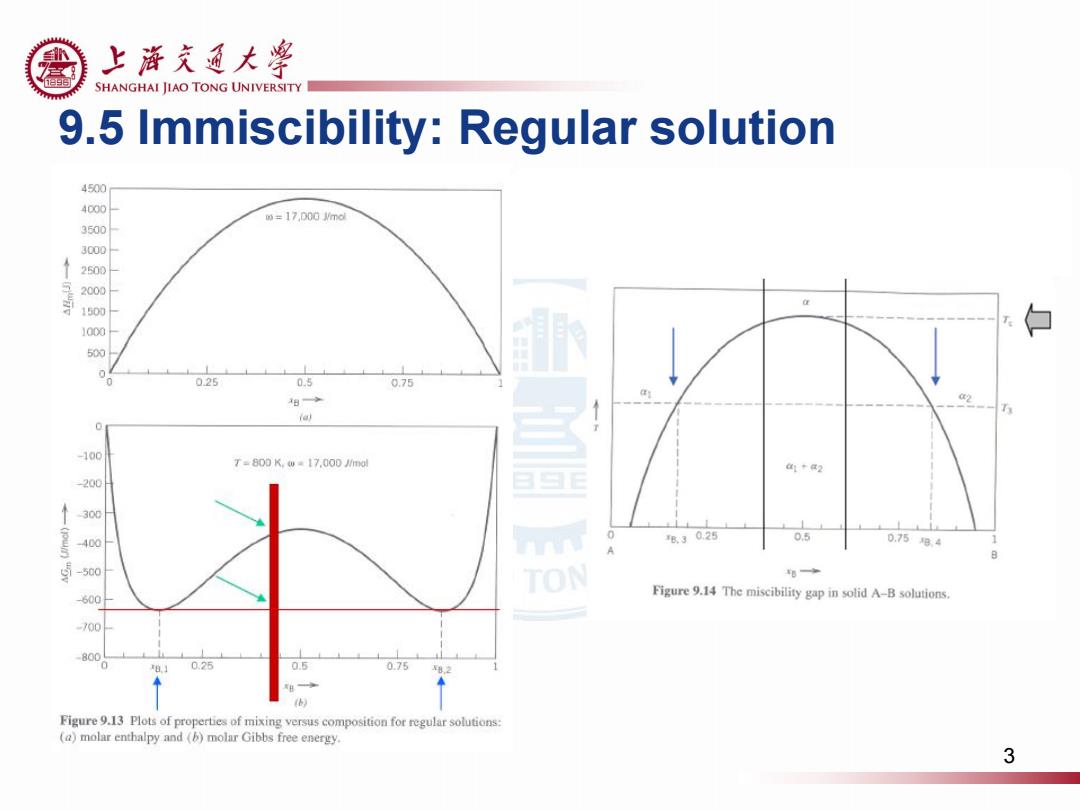
9.5 Immiscibility: Regular solution 3
上游充通大粤 色 SHANGHAI JIAO TONG UNIVERSITY 9.6 Spinodal points 1050 1000 line 750 0 -100 600 T=800K,w=17,000 J/mol 0.25 0.5 0.75 -200 The decomposition here will cause the increase of Gibbs free energy Figure 9.15 The miscibility gap,showing spinodal line. 300 and therefore is relatively not favored 400 -500 △Gm decrease upon decomposition -600 -700 △Gm increase upon decomposition -800 0 xB.1 0.25 0.5 0.75 XB.2 xB→ 4
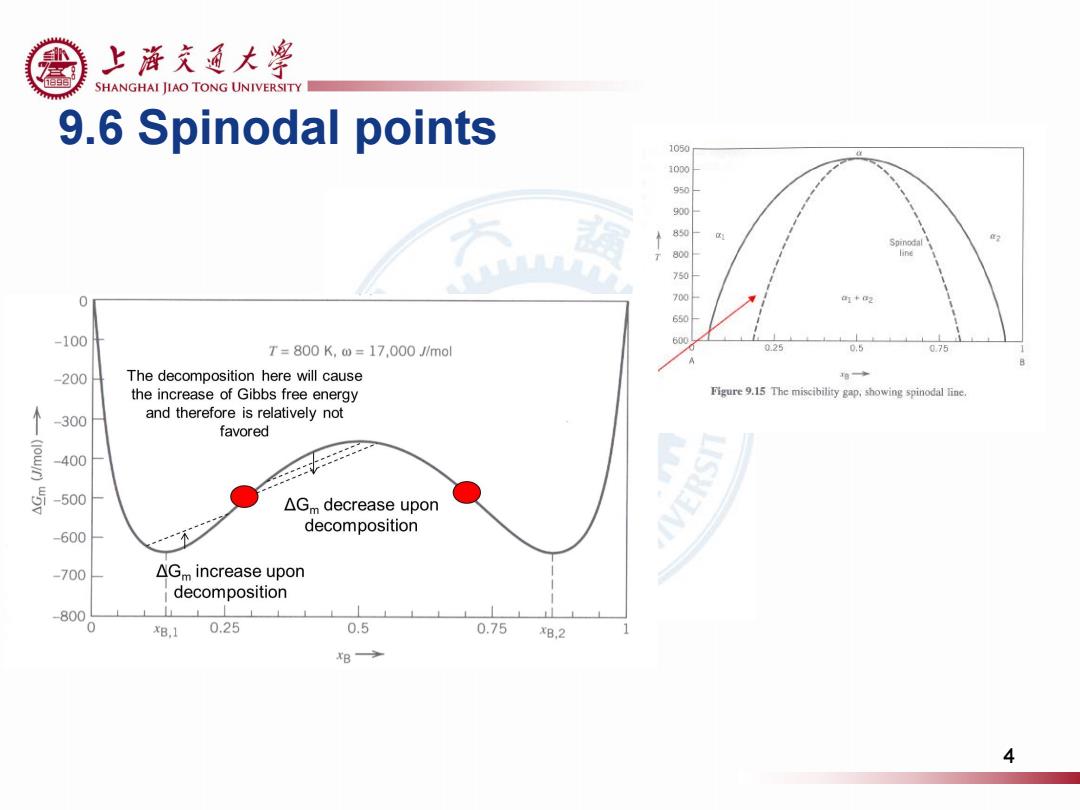
9.6 Spinodal points 4
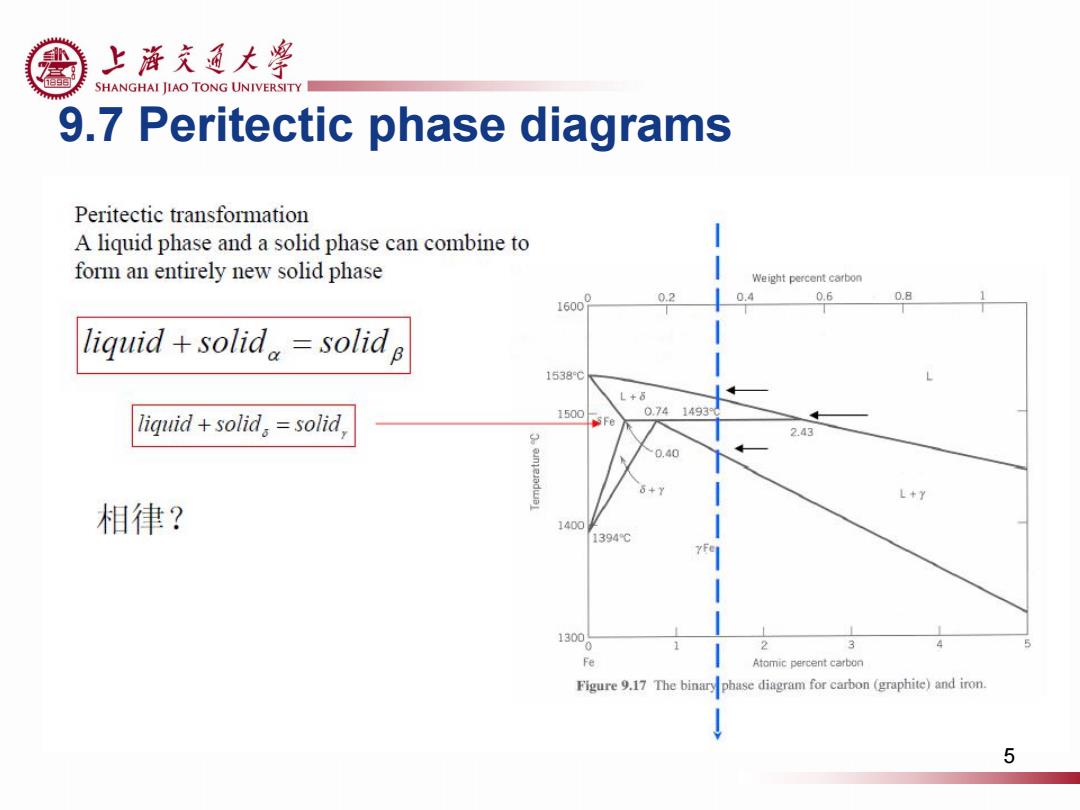
上游充通大¥ SHANGHAI JIAO TONG UNIVERSITY 9.7 Peritectic phase diagrams Peritectic transformation A liquid phase and a solid phase can combine to form an entirely new solid phase Weight percent carbon 02 0.4 0.6 0.8 liquid+solid。=solid B 1538℃ L+6 0.741493 1 iquid+solid。=solid 1500 5Fe 2.43 0.40 onjeradwBl 6+y L+7 相律? 1400 1394℃ YFe 1300 2 Fe Atomic percent carbon Figure 9.17 The binary phase diagram for carbon(graphite)and iron. 5
9.7 Peritectic phase diagrams 5

上游充通大粤 SHANGHAI JIAO TONG UNIVERSITY 9.8 Compounds 1600 1414 Mg:Si L 1200 L+Si 1087 946.7 赵 L+Mg 56.5 800 L+Mg2Si L+Mg:Si 649 638.8 MgSi+Si 1.38 Mg+Mg2Si 400 M 10 20 30 40 50 60 70 80 90 Si w(Si)/% 6
9.8 Compounds 6
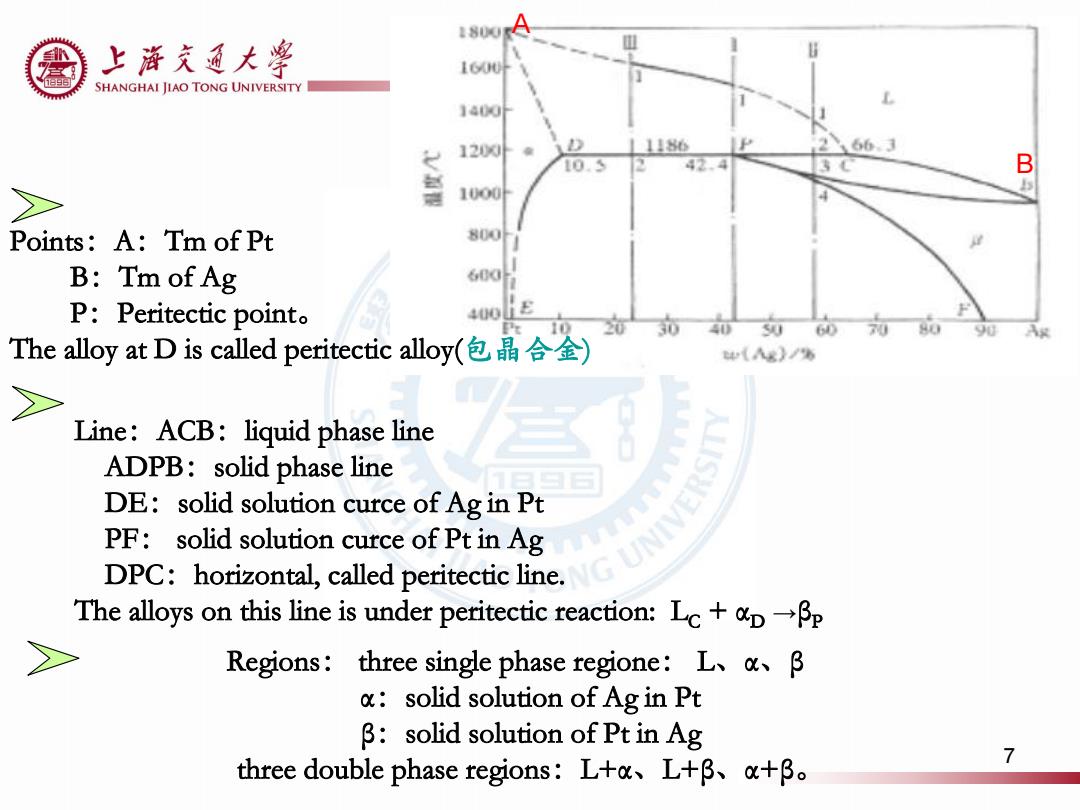
1800A 上游充通大¥ 160U叶 SHANGHAI JIAO TONG UNIVERSITY 1400F 1200外 1186 66.3 10.5 B 1000 Points:A:Tm of Pt 800 B:Tm of Ag 600 P:Peritectic point。 400L The alloy at D is called peritectic alloy(包晶合金) (x)/% 2> Line:ACB:liquid phase line ADPB:solid phase line DE:solid solution curce of Ag in Pt PF:solid solution curce of Pt in Ag DPC:horizontal,called peritectic line. The alloys on this line is under peritectic reaction:Lc+pBp Regions:three single phase regione:L、ak、β solid solution of Ag in Pt β:solid solution of Pt in Ag three double phase regions:Ltau、L+β、a+B。 7
A Points:A:Tm of Pt B:Tm of Ag P:Peritectic point。 The alloy at D is called peritectic alloy(包晶合金) Line:ACB:liquid phase line ADPB:solid phase line DE:solid solution curce of Ag in Pt PF: solid solution curce of Pt in Ag DPC:horizontal, called peritectic line. The alloys on this line is under peritectic reaction: LC + αD →βP Regions: three single phase regione: L、α、β α:solid solution of Ag in Pt β:solid solution of Pt in Ag three double phase regions:L+α、L+β、α+β。 B 7
上游充通大粤 e SHANGHAI JIAO TONG UNIVERSITY Usage of phase diagrams 1 al with multi-components system -phase rule -Phase diagrams: 1.equilibrium phases under different conditions 2.What will happen to the phases while the Temp,pressure and/or composition changes 3.The conditions for phase transformation To investigate new materials Critical evidence to analyze the alloy components,chemical composition, and to design the manufacturing and thermal treatment process 8
Usage of phase diagrams 1 To deal with multi-components system -phase rule -Phase diagrams: 1.equilibrium phases under different conditions 2.What will happen to the phases while the Temp, pressure and/or composition changes 3.The conditions for phase transformation To investigate new materials Critical evidence to analyze the alloy components, chemical composition, and to design the manufacturing and thermal treatment process 8
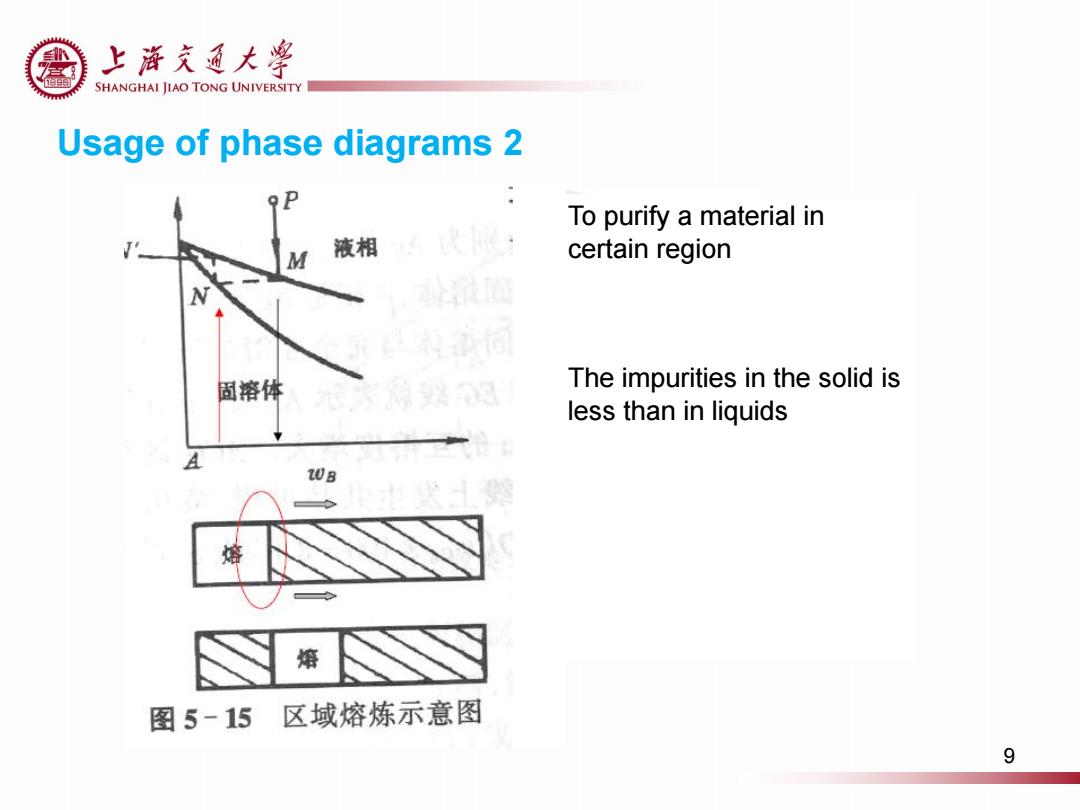
上游充通大¥ SHANGHAI JIAO TONG UNIVERSITY Usage of phase diagrams 2 To purify a material in M 液相 certain region 固溶体 The impurities in the solid is less than in liquids 20B 熔 熔 图5-15区域熔炼示意图 9
Usage of phase diagrams 2 To purify a material in certain region The impurities in the solid is less than in liquids 9
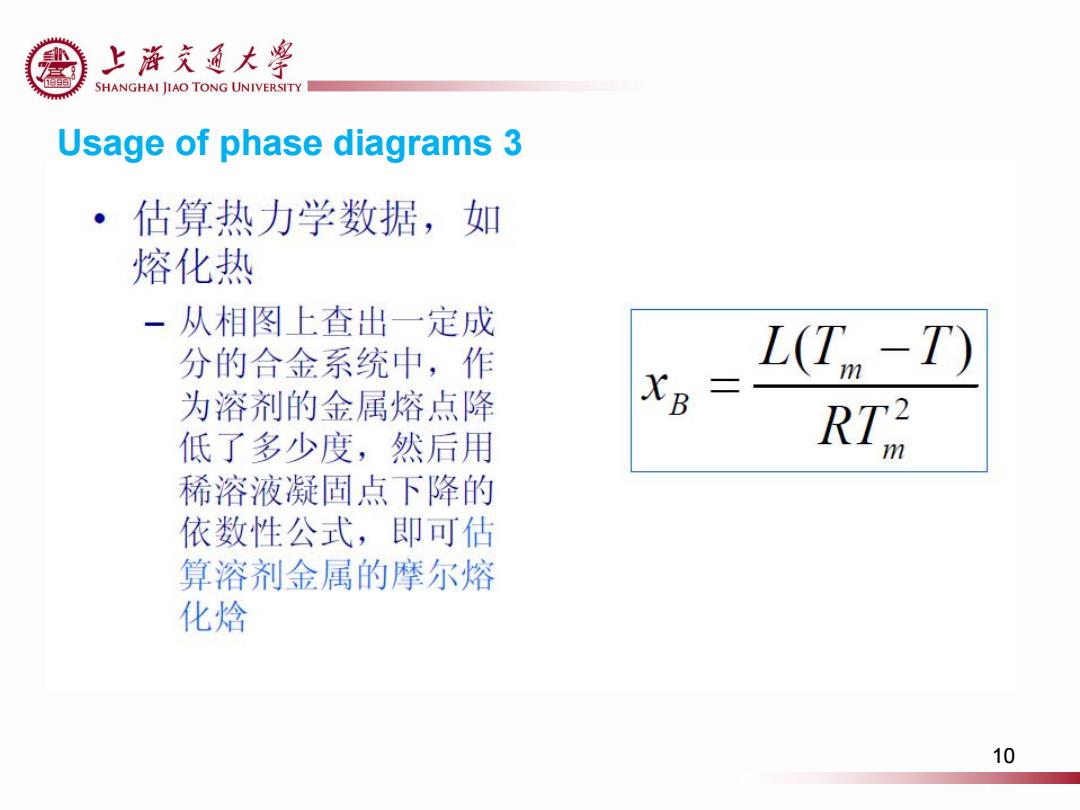
上游充通大粤 SHANGHAI JIAO TONG UNIVERSITY Usage of phase diagrams 3 ·估算热力学数据,如 熔化热 一从相图上查出一定成 分的合金系统中,作 L(T-T) 为溶剂的金属熔点降 XB= 低了多少度,然后用 RTR 稀溶液凝固点下降的 依数性公式,即可估 算溶剂金属的摩尔熔 化焓 10
Usage of phase diagrams 3 10