Efficiency with Costly Information:A Reinterpretation of Evidence from Managed Portfolios TOR Edwin J.Elton;Martin J.Gruber;Sanjiv Das;Matthew Hlavka The Review of Financial Studies,Volume 6,Issue 1 (1993),1-22. Stable URL: hup://links.jstor.org/sici?sici=0893-9454%281993%296%3A1%3C1%3AEWCIAR3E2.0.CO%3B2-8 Your use of the JSTOR archive indicates your acceptance of JSTOR's Terms and Conditions of Use,available at http://www.jstor.org/about/terms.html.JSTOR's Terms and Conditions of Use provides,in part,that unless you have obtained prior permission,you may not download an entire issue of a journal or multiple copies of articles,and you may use content in the JSTOR archive only for your personal,non-commercial use. Each copy of any part of a STOR transmission must contain the same copyright notice that appears on the screen or printed page of such transmission. The Review of Financial Studies is published by Oxford University Press.Please contact the publisher for further permissions regarding the use of this work.Publisher contact information may be obtained at http://www.jstor.org/journals/oup.html. The Review of Financial Studies 1993 Oxford University Press JSTOR and the JSTOR logo are trademarks of JSTOR,and are Registered in the U.S.Patent and Trademark Office. For more information on JSTOR contact jstor-info@umich.edu. ©2003 JSTOR http://www.jstor.org/ Tue Feb1801:31:122003
Efficiency with Costly Information:A Reinterpretation of Evidence from Managed Portfolios Edwin J.Elton Martin J.Gruber Sanjiv Das Matthew Hlavka New York University We investigate the informational efficiency of mutual fund performance for the period 1965-84. Results are sbown to be sensitive to the measure- ment of performance cbosen.We find that returns on S&P stocks,returns on non-S&P stocks,and returns on bonds are significant factors in per- formance assessment.Once we correct for the impact of non-S&P assets on mutual fund returns, we find that mutual funds do not earn returns tbat justify tbeir information acquisition costs.This is consistent witb results for prior periods. The evaluation of professional money management has long been a topic of considerable interest to finan- cial economists.Two developments have stimulated renewed interest in this topic.The first is the work of Grossman (1976)and Grossman and Stiglitz (1980). They argue that trades by informed investors take place at prices that compensate these investors for the cost of becoming informed.Under these conditions,it is The authors would like to thank Eugene Fama,Andrew Lo,William Sharpe, and the referee (Bruce Lehmann)for helpful comments and suggestions on an earlier version of this article.We have benefited from useful suggestions received at workshop presentations at MIT,the University of Chicago,and the University of Michigan and presentation at the European Finance Asso- ciation.Address correspondence to Edwin J.Elton and Martin Gruber,Stern School of Business,Department of Finance,44 West 4th Street,New York, NY10012. Tbe Review of Financial Studtes 1993 Volume 6,number 1,pp.1-22 1993 The Review of Financial Studies 0893-9454/93/$1.50
The Review of Financial Studies/v6n 1 1993 possible for informed investment managers to pass on the cost of analysis to their clients and for their clients to be no worse off after reimbursing managers for the cost of becoming informed.Managers who charge higher fees do not necessarily earn lower returns for their clients.Higher fees may or may not be associated with lower returns, depending not on the efficiency of security markets,but rather on the efficiency of the market for money managers. The second development stems from the work of Roll (1977)and Ross (1977)and its implication for the evaluation of the money man- ager.Roll's argument against the use of CAPM as a benchmark for performance together with Ross's discovery of arbitrage pricing theory has led to questions about the appropriate benchmarks against which to judge abnormal performance. Recent work,particularly that of Lehman and Modest (1987),Admati et al.(1986),Conner and Korajczyk (1991),and Grinblatt and Titman (1989),raise further questions about the appropriate benchmark to use in evaluating performance.In particular,Lehman and Modest (1987)stress the sensitivity of performance to the benchmark chosen and the need to find a set of benchmarks that represent the common factors determining security returns.This literature should be con- trasted with a set of literature that seems to indicate that a single- index model provides an adequate description of portfolio returns and that the evaluation of the returns is reasonably insensitive to the definition of the index used.For example,Roll (1971)found that three market proxies provided nearly identical performance measures for randomly selected portfolios.Copeland and Mayers (1982)found that inferences about the value Line Enigma were unaffected by the choice of a performance benchmark. Our purpose in this article is to show that even a very parsimonious description of the proxies generating returns on portfolios of bonds and stocks can lead to very different and superior inferences about the attributes of active portfolio management compared to a single index.We use as an example the data used (and conclusions reached) in a recent study of mutual fund performance by Ippolito (1989).The Ippolito study is important because it is the first test of the expanded (Grossman)definition of market efficiency using data on managed portfolios.In addition,Ippolito's study is interesting because his results and conclusions are different from those reached in a long series of mutual fund studies. Ippolito has at least two findings that are important and consistent with a theory of efficiency with informed investors. (1)Estimated risk adjusted return (@)for the mutual fund industry 2
Efficiency with Costly Information is greater than zero even after accounting for transaction costs and expenses.Ippolito attributes nonnegative a to the existence of informed actions by management. (2)There does not seem to be any evidence that turnover,man- agement fees,or expenses are associated with inferior returns,net of management fees and expenses. These results and conclusions are very different from those reached by earlier researchers [see Jensen (1968),Friend,Blume,and Crockett (1970),and Sharpe (1966)].In particular,they are different from the results presented by Jensen,who found a negative a on average for a broad sample of mutual funds over the periods 1955-1964 and 1945- 1964. In this article,we show that Ippolito's results are primarily due to the difference in the performance of non-S&P 500 assets in the Ippoli- to period (1965-1984)compared to the performance of these assets in the Jensen period.1 Furthermore,once we explicitly account for mutual funds holding non-S&P assets,the results of the type of anal- ysis Ippolito performs change and are identical to those found in earlier studies. In the first section of this article,we examine the effect of holding non-S&P equities and bonds on alphas of mutual funds.Mutual funds have historically held some stocks not in the s&P index and held some stocks in the S&P index in proportions below their weighting in the S&P index.We shall see that holding non-S&P stocks would cause negative a's for funds over the earlier period studied by Jensen and positive a's for funds over the period studied by Ippolito,even if management had no selection ability.In both the earlier period and the latter period,the effect of bonds being part of the portfolio had very little impact on a.2 Having documented in the first section of this article two influences that could account for the positive a's found by Ippolito,we then correct for these influences.This is done by introducing two new indexes into the standard one-index performance measurement model. This allows us to examine if funds have a positive a above and beyond that arising from extending holdings beyond the s&P 500. In the final section,we examine the influence of expenses and turnover on a when we have explicitly taken into account the effect of non-S&P assets. In part,his results are also due to data errors that led to a particular bias.This will be explored in later sections of the article. Bonds impact a indirectly if the presence of bonds means that the aggregate portfolio has a smaller percentage of non-S&P stocks. 3
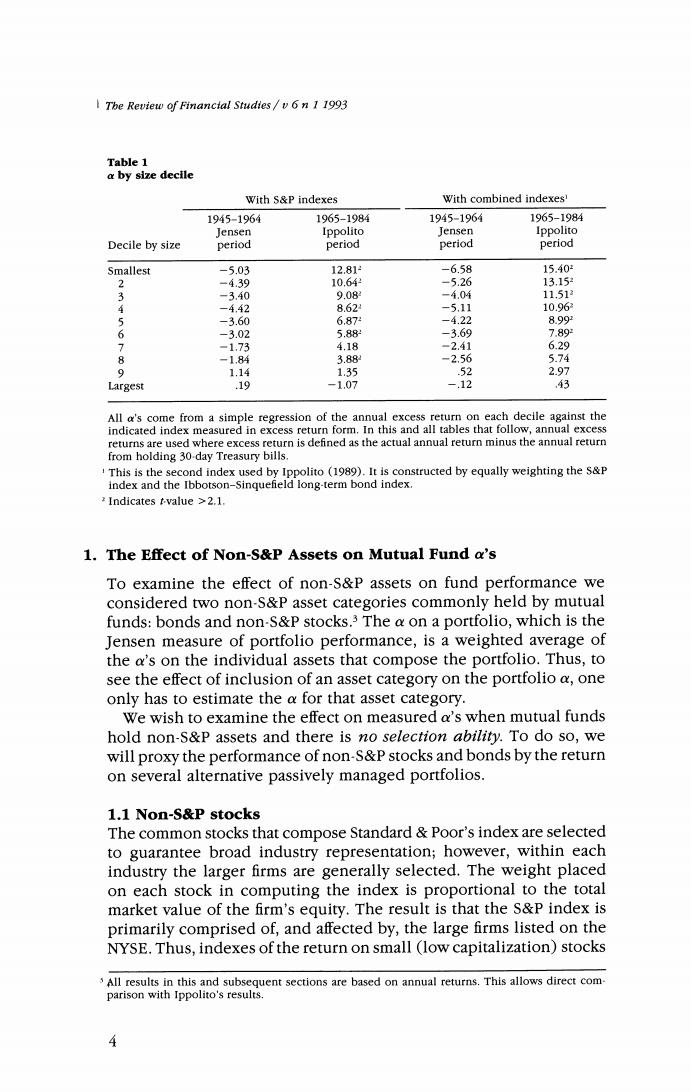
Tbe Review of Financtal Studies/v 6 n 1 1993 Table 1 a by size decile With S&P indexes With combined indexes 1945-1964 1965-1984 1945-1964 1965-1984 Jensen Ippolito Jensen Ippolito Decile by size period period period period Smallest -5.03 12.812 -6.58 15.40- 2 -4.39 10.64 -5.26 13.15 3 -3.40 9.08 -4.04 11.51 4 -4.42 8.62 -5.11 10.963 5 -3.60 6.87 -4.22 8.992 6 -3.02 5.88 -3.69 7.89 7 -1.73 4.18 -2.41 6.29 8 -1.84 3.88 -2.56 5.74 9 1.14 1.35 .52 2.97 Largest .19 -1.07 -.12 ,43 All a's come from a simple regression of the annual excess return on each decile against the indicated index measured in excess return form.In this and all tables that follow,annual excess returns are used where excess return is defined as the actual annual return minus the annual return from holding 30-day Treasury bills. This is the second index used by Ippolito(1989).It is constructed by equally weighting the s&P index and the Ibbotson-Sinquefield long-term bond index. Indicates tvalue >2.1. 1.The Effect of Non-S&P Assets on Mutual Fund a's To examine the effect of non-S&P assets on fund performance we considered two non-S&P asset categories commonly held by mutual funds:bonds and non-S&P stocks.3 The a on a portfolio,which is the Jensen measure of portfolio performance,is a weighted average of the a's on the individual assets that compose the portfolio.Thus,to see the effect of inclusion of an asset category on the portfolio a,one only has to estimate the a for that asset category. We wish to examine the effect on measured a's when mutual funds hold non-S&P assets and there is no selection ability.To do so,we will proxy the performance of non-S&P stocks and bonds by the return on several alternative passively managed portfolios. 1.1 Non-S&P stocks The common stocks that compose Standard Poor's index are selected to guarantee broad industry representation;however,within each industry the larger firms are generally selected.The weight placed on each stock in computing the index is proportional to the total market value of the firm's equity.The result is that the S&P index is primarily comprised of,and affected by,the large firms listed on the NYSE.Thus,indexes of the return on small (low capitalization)stocks All results in this and subsequent sections are based on annual returns.This allows direct com parison with Ippolito's results
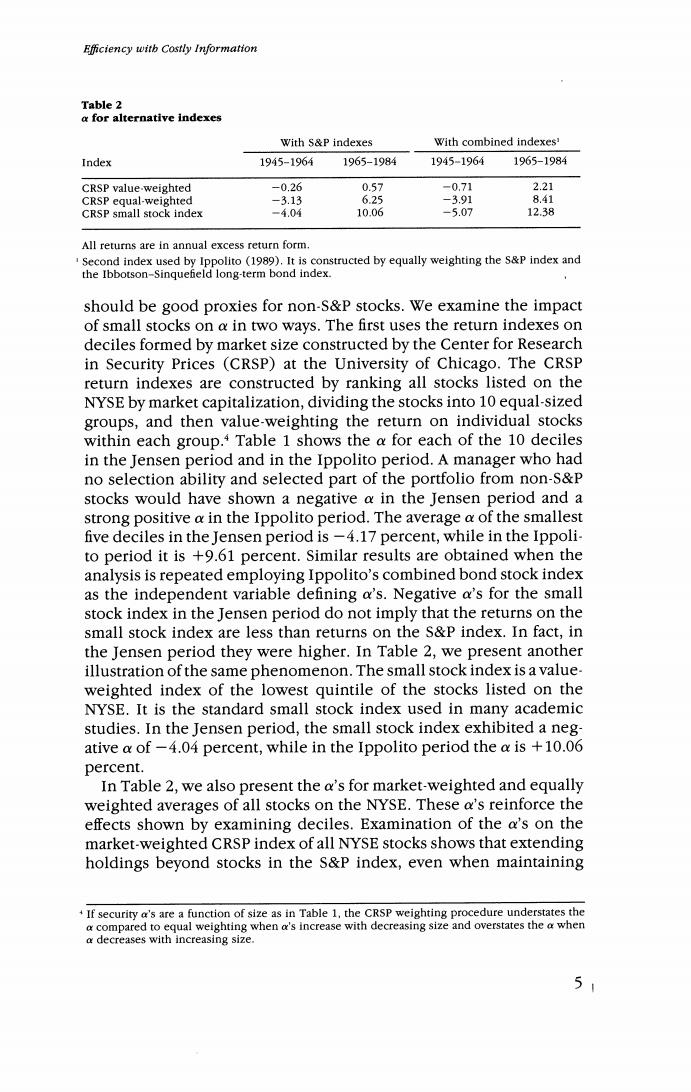
Efficiency witb Costly Information Table 2 a for alternative indexes With S&P indexes With combined indexes' Index 1945-1964 1965-1984 1945-1964 1965-1984 CRSP value-weighted -0.26 0.57 -0.71 2.21 CRSP equal-weighted -3.13 6.25 -3.91 8.41 CRSP small stock index -4.04 10.06 -5.07 12.38 All returns are in annual excess return form. Second index used by Ippolito (1989).It is constructed by equally weighting the s&P index and the Ibbotson-Singuefeld long-term bond index. should be good proxies for non-S&P stocks.We examine the impact of small stocks on a in two ways.The first uses the return indexes on deciles formed by market size constructed by the Center for Research in Security Prices (CRSP)at the University of Chicago.The CRSP return indexes are constructed by ranking all stocks listed on the NYSE by market capitalization,dividing the stocks into 10 equal-sized groups,and then value-weighting the return on individual stocks within each group.Table 1 shows the a for each of the 10 deciles in the Jensen period and in the Ippolito period.A manager who had no selection ability and selected part of the portfolio from non-S&P stocks would have shown a negative a in the Jensen period and a strong positive a in the Ippolito period.The average a of the smallest five deciles in the Jensen period is-4.17 percent,while in the Ippoli- to period it is +9.61 percent.Similar results are obtained when the analysis is repeated employing Ippolito's combined bond stock index as the independent variable defining a's.Negative a's for the small stock index in the Jensen period do not imply that the returns on the small stock index are less than returns on the S&P index.In fact,in the Jensen period they were higher.In Table 2,we present another illustration of the same phenomenon.The small stock index is a value- weighted index of the lowest quintile of the stocks listed on the NYSE.It is the standard small stock index used in many academic studies.In the Jensen period,the small stock index exhibited a neg- ative a of-4.04 percent,while in the Ippolito period the a is +10.06 percent. In Table 2,we also present the a's for market-weighted and equally weighted averages of all stocks on the NYSE.These a's reinforce the effects shown by examining deciles.Examination of the a's on the market-weighted CRSP index of all NYSE stocks shows that extending holdings beyond stocks in the S&P index,even when maintaining If security a's are a function of size as in Table 1,the CRSP weighting procedure understates the a compared to equal weighting when a's increase with decreasing size and overstates the a when a decreases with increasing size. 5
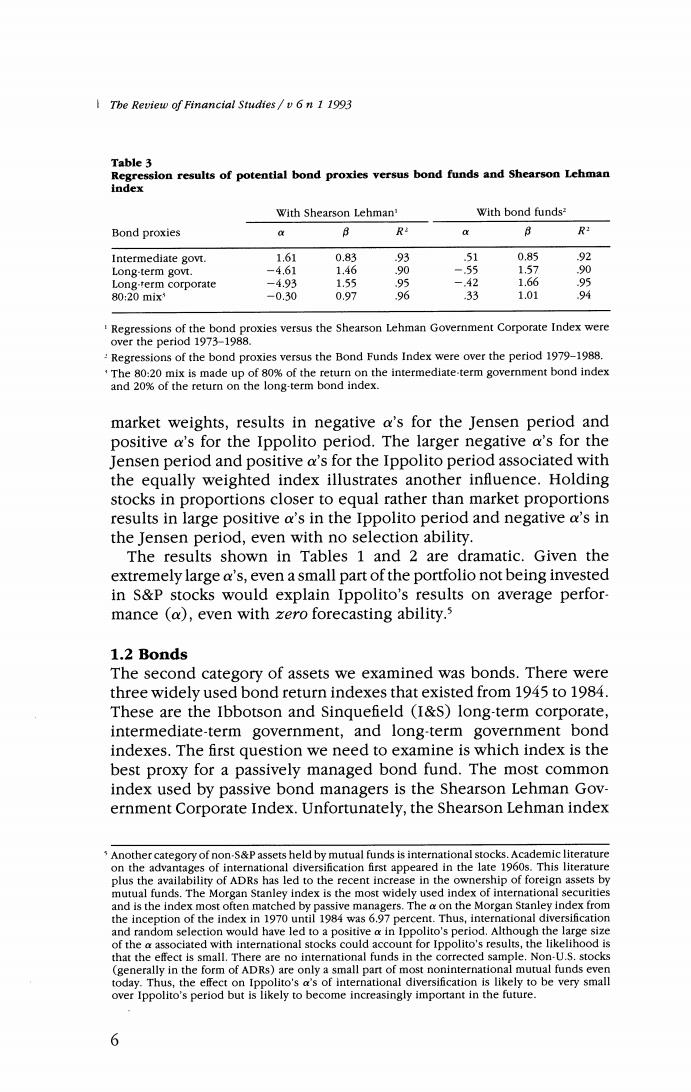
The Review of Financial Studies/v 6n 1 1993 Table 3 Regression results of potential bond proxies versus bond funds and Shearson Lehman index With Shearson Lehman' With bond funds? Bond proxies 心 R 8 R Intermediate govt. 1.61 0.83 93 51 0.85 92 Long-term govt. -4.61 1.46 90 -.55 1.57 0 Long-term corporate -4.93 1.55 -.42 1.66 95 80:20mix -0.30 0.97 % 33 1.01 Regressions of the bond proxies versus the Shearson Lehman Government Corporate Index were over the period 1973-1988. Regressions of the bond proxies versus the Bond Funds Index were over the period 1979-1988. The 80:20 mix is made up of 80%of the return on the intermediate.term government bond index and 20%of the return on the long-term bond index. market weights,results in negative a's for the Jensen period and positive a's for the Ippolito period.The larger negative a's for the Jensen period and positive a's for the Ippolito period associated with the equally weighted index illustrates another influence.Holding stocks in proportions closer to equal rather than market proportions results in large positive a's in the Ippolito period and negative a's in the Jensen period,even with no selection ability. The results shown in Tables 1 and 2 are dramatic.Given the extremely large a's,even a small part of the portfolio not being invested in S&P stocks would explain Ippolito's results on average perfor- mance (a),even with zero forecasting ability.s 1.2 Bonds The second category of assets we examined was bonds.There were three widely used bond return indexes that existed from 1945 to 1984. These are the Ibbotson and Sinquefield (I&S)long-term corporate, intermediate-term government,and long-term government bond indexes.The first question we need to examine is which index is the best proxy for a passively managed bond fund.The most common index used by passive bond managers is the Shearson Lehman Gov- ernment Corporate Index.Unfortunately,the Shearson Lehman index Another category of non-S&P assets held by mutual funds is international stocks.Academic literature on the advantages of international diversification first appeared in the late 1960s.This literature plus the availability of ADRs has led to the recent increase in the ownership of foreign assets by mutual funds.The Morgan Stanley index is the most widely used index of international securities and is the index most often matched by passive managers.The a on the Morgan Stanley index from the inception of the index in 1970 until 1984 was 6.97 percent.Thus,international diversification and random selection would have led to a positive a in Ippolito's period.Although the large size of the a associated with international stocks could account for Ippolito's results,the likelihood is that the effect is small.There are no international funds in the corrected sample.Non-U.S.stocks (generally in the form of ADRs)are only a small part of most noninternational mutual funds even today.Thus,the effect on Ippolito's a's of international diversification is likely to be very small over Ippolito's period but is likely to become increasingly important in the future. 6
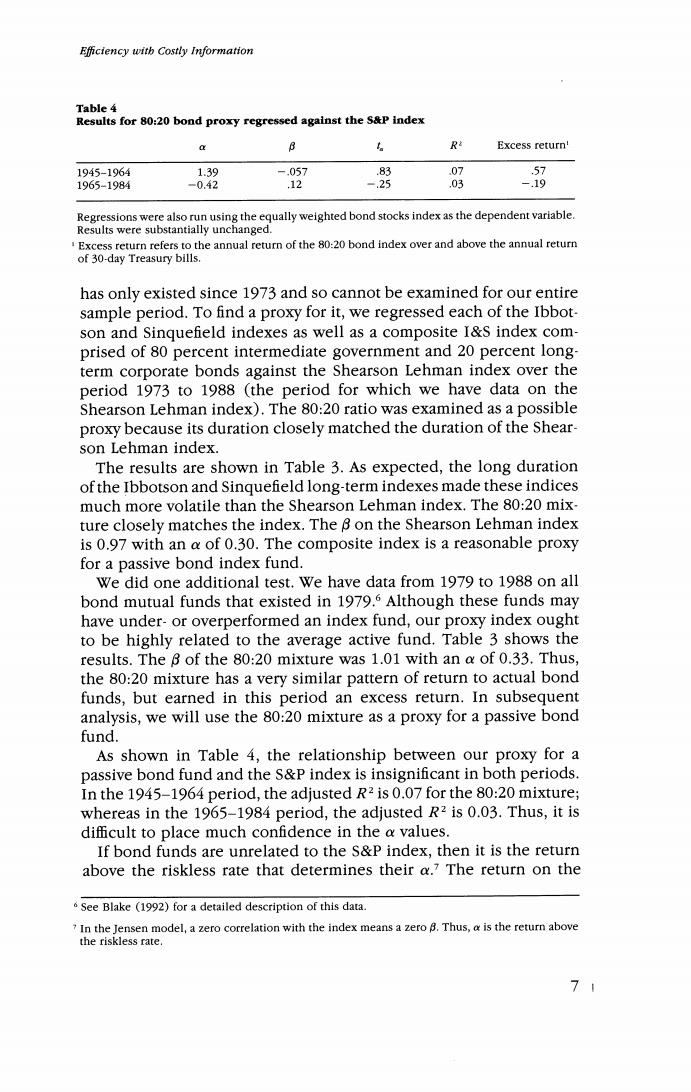
Efficiency witb Costly Information Table 4 Results for 80:20 bond proxy regressed against the S&P index a B R Excess return' 1945-1964 1.39 -.057 83 .07 57 1965-1984 -0.42 .12 -.25 .03 -.19 Regressions were also run using the equally weighted bond stocks index as the dependent variable. Results were substantially unchanged. Excess return refers to the annual return of the 80:20 bond index over and above the annual return of 30-day Treasury bills. has only existed since 1973 and so cannot be examined for our entire sample period.To find a proxy for it,we regressed each of the Ibbot- son and Sinquefield indexes as well as a composite I&S index com- prised of 80 percent intermediate government and 20 percent long- term corporate bonds against the Shearson Lehman index over the period 1973 to 1988 (the period for which we have data on the Shearson Lehman index).The 80:20 ratio was examined as a possible proxy because its duration closely matched the duration of the Shear- son Lehman index. The results are shown in Table 3.As expected,the long duration of the Ibbotson and Sinquefield long-term indexes made these indices much more volatile than the Shearson Lehman index.The 80:20 mix- ture closely matches the index.The 8 on the Shearson Lehman index is 0.97 with an a of 0.30.The composite index is a reasonable proxy for a passive bond index fund. We did one additional test.We have data from 1979 to 1988 on all bond mutual funds that existed in 1979.5 Although these funds may have under-or overperformed an index fund,our proxy index ought to be highly related to the average active fund.Table 3 shows the results.The B of the 80:20 mixture was 1.01 with an a of 0.33.Thus, the 80:20 mixture has a very similar pattern of return to actual bond funds,but earned in this period an excess return.In subsequent analysis,we will use the 80:20 mixture as a proxy for a passive bond fund. As shown in Table 4,the relationship between our proxy for a passive bond fund and the S&P index is insignificant in both periods. In the 1945-1964 period,the adjusted R2 is 0.07 for the 80:20 mixture; whereas in the 1965-1984 period,the adjusted R2 is 0.03.Thus,it is difficult to place much confidence in the a values. If bond funds are unrelated to the S&P index,then it is the return above the riskless rate that determines their a.7 The return on the See Blake (1992)for a detailed description of this data. 7 In the Jensen model,a zero correlation with the index means a zero B.Thus,a is the return above the riskless rate. 71
The Review of Financial Studies/v 6n 1 1993 bond proxy was 0.57 percent above the riskless rate in the first period and-0.19 percent in the second.The magnitude of the a's and excess returns for bonds are much smaller than the magnitude of the a's and excess returns for other non-S&P assets.Thus,any effects of mutual funds holding debt on the mutual fund a's are likely to be swamped by other influences.However,bonds do mitigate to a limited extent the effect of other non-S&P assets.Although the performance of bonds is unlikely to affect results in the Ippolito period,the reader should be cautious about generalizing.Most studies analyze about 10 years of data.We examined all 10-year periods in our sample.The average a for bonds on the S&P index varied from -2.6 to +1.0.Most recent studies have factor-analyzed stock returns in order to obtain a return generating process.Unless some of the factors that are produced by factor-analyzing equity returns are highly correlated with bond returns, the average a on balanced funds could be heavily influenced by the bond a. 2.Adjusting for Other Indexes In the prior section we showed that inclusion of non-S&P assets in a mutual fund portfolio would result in nonzero a's,even if selection of all assets was random.The magnitude of the impact is a direct function of the fraction of non-S&P assets held.Since the fraction of non-S&P assets held by a fund is correlated with many of the char- acteristics of funds we wish to examine,it is important to control for this effect.In this section,we will discuss how one can control for the effect of non-S&P assets on mutual fund a's.8 One way to view a mutual fund is as a combination of three port- folios:one containing S&P stocks,one containing non-S&P stocks, and one containing bonds.The return on the fund is a weighted average of the return on the three portfolios.Management perfor- mance is the extra return earned on the fund compared to holding a combination of three passive portfolios with the same characteristics as the overall fund.The measure of performance developed from this approach can be considered a generalization of the Jensen measure to encompass the situation where managers hold non-S&P stocks and The other way to control for the effect of the non-$&P assets is the multifactor approach of Lehman and Modest (1987),Grinblatt and Titman (1989),Conner and Korajczyk(1991),and Jagannathan and Korajczyk(1986),where the factors include bond factors.The disadvantage of this approach is that the factors do not have passive portfolios that are actively traded in the market.Thus,an investor would be unable to replicate this strategy. 8
Efficiency witb Costly Information bonds.3 It could also be considered a measure of performance given a belief in a three-factor return generating process.If a passive port- folio interpretation of the model is employed,one must consider costs. Mutual fund returns are net of management fees and trading costs When utilizing indexes as proxies for passive portfolios,these costs are not subtracted.The question that needs to be analyzed is how much lower are the returns on passive portfolios after fees are deducted relative to the indexes they duplicate.Institutional investors have available passive S&P index portfolios and bond portfolios that almost exactly match indexes after all fees and trading costs.For individual investors,index funds such as the Vanguard funds match the index within 25 basis points for the part of the fund not in cash.A number of analysts argue that returns on small stock indexes are unattainable by actual portfolio managers because of high transaction costs [e.g., Fouse (1989)and Stoll and Whaley (1983)].Sinquefield(1991)exam- ined the returns on the five passive small stock index funds with any substantial history.He found that net of trading costs and management fees,the passive funds earned 2 basis points per month more than the particular small stock index they followed.The worst shortfall was 12 basis points per month.Thus,even for small stocks,index returns may well be reasonable measures of passive returns net of costs,and a deduction of 25 basis points would be a generous adjust- ment. The return on an active fund relative to the return on the three passive portfolios is R:-Re=a:+Bi(RM-Re)+Bis (Rs-Re)+BiD(Rp-R)+e In this model,10 R is the return on the S&P 500 index,Rs is the return on a non-S&P equity index that has been made orthogonal to the S&P index,Rp is the return on a bond return index that has been made orthogonal to both the s&P and the non-S&P equity index,By is the sensitivity of portfolio i to the relevant index i,and e,is the residual risk. We will use two alternative proxies for the returns on non-S&P stocks:the small stock index and a value-weighted index of all NYSE stocks,each with the effect of the S&P removed.By orthogonalizing (removing the effect of another index from)the non-S&P indexes, we lose the interpretation of each index as the return on a passive The Jensen measure is usually stated with an equilibrium interpretation.Another interpretation is that it is the extra return earned by a manager compared to the return on a combination of an index fund and Treasury bills of the same risk. This regression model is consistent with a multifactor asset-pricing model.In independent research, Sharpe (1988)has developed a nine-index model based on asset classes to decompose investment returns. 9