
Lecture 3: Managing Financial Health and Performance Objectives .Financial analysis Purpose of Financial Plannin king Capital Manage .THE COURSE OF FINANCE 2017 SPRING SJTU
Lecture 3: Managing Financial Health and Performance •THE COURSE OF FINANCE 2017 SPRING SJTU •1 Objectives •Financial analysis •Purpose of Financial Planning •Working Capital Management

Chapter 3 Contents 3.1 Functions of 3.6 Analysis Using Financial Statements Financial Ratios 3.2 Review of Financial 3.7 The Financial Statement Planning Process 3.3 Market values v. 3.8 Constructing a Book Values Financial Planning 3.4 Accounting v. Model Economic Measures of 3.9 Growth the Need Income for External Financing 3.5 Return on 3.10 Working Capital Shareholders v.Return Mgmt. on Book Equity 3.11 Liquidity Cash Mgmt. .THE COURSE OF FINANCE 2017 SPRING SJTU
Chapter 3 Contents 3.1 Functions of Financial Statements 3.2 Review of Financial Statement 3.3 Market values v. Book Values 3.4 Accounting v. Economic Measures of Income 3.5 Return on Shareholders v. Return on Book Equity 3.6 Analysis Using Financial Ratios 3.7 The Financial Planning Process 3.8 Constructing a Financial Planning Model 3.9 Growth & the Need for External Financing 3.10 Working Capital Mgmt. 3.11 Liquidity & Cash Mgmt. •THE COURSE OF FINANCE 2017 SPRING SJTU •2
3.1 Functions of Financial Statements Financial Statements: Provide information of a firm about the current status and past performance D Provide a convenient way to set performance targets to impose restrictions of the managers of the firm Provide a convenient templates for financial planning .THE COURSE OF FINANCE 2017 SPRING SJTU
3.1 Functions of Financial Statements Financial Statements: Provide information of a firm about the current status and past performance Provide a convenient way to set performance targets & to impose restrictions of the managers of the firm Provide a convenient templates for financial planning •THE COURSE OF FINANCE 2017 SPRING SJTU •3
3.2 Review of Financial Statements Balance Sheets Income Statements Cash-Flow Statements .THE COURSE OF FINANCE 2017 SPRING SJTU
3.2 Review of Financial Statements Balance Sheets Income Statements Cash-Flow Statements •THE COURSE OF FINANCE 2017 SPRING SJTU •4
The Balance Sheet Summarizes a firms assets,liabilities,and owner's equity at a moment in time Amounts measured at historical values and historical exchange rates Prepared according to GAAP,Generally Accepted Accounting Principles D GAAP modified occasionally by the Financial Accounting Standards Board Exchange-listed companies in USA must comply with Securities and Exchange Commission (SEC)rules .THE COURSE OF FINANCE 2017 SPRING SJTU
The Balance Sheet Summarizes a firms assets, liabilities, and owner’s equity at a moment in time Amounts measured at historical values and historical exchange rates Prepared according to GAAP, Generally Accepted Accounting Principles GAAP modified occasionally by the Financial Accounting Standards Board Exchange-listed companies in USA must comply with Securities and Exchange Commission (SEC) rules •THE COURSE OF FINANCE 2017 SPRING SJTU •5
The Balance Sheet Major Divisions: Assets Current assets (less than a year) Long-term assets (longer than a year) Depreciation Liabilities and Stockholder's Equity Liabilities Current Liabilities Long-term debt Equity .THE COURSE OF FINANCE 2017 SPRING SJTU
The Balance Sheet Major Divisions: Assets Current assets (less than a year) Long-term assets (longer than a year) Depreciation Liabilities and Stockholder’s Equity Liabilities Current Liabilities Long-term debt Equity •THE COURSE OF FINANCE 2017 SPRING SJTU •6
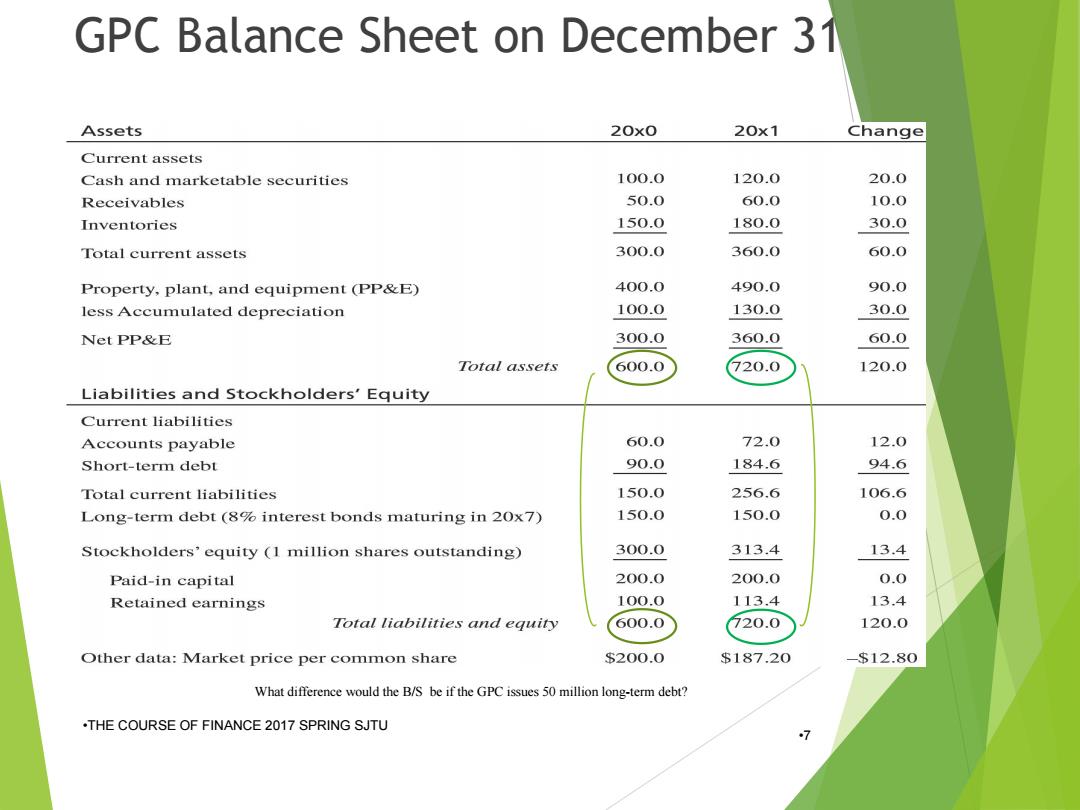
GPC Balance Sheet on December 31 Assets 20x0 20x1 Change Current assets Cash and marketable securities 100.0 120.0 20.0 Receivables 50.0 60.0 10.0 Inventories 150.0 180.0 30.0 Total current assets 300.0 360.0 60.0 Property,plant,and equipment (PP&E) 400.0 490.0 90.0 less Accumulated depreciation 100.0 130.0 30.0 Net PP&E 300.0 360.0 60.0 Total assets 600.0 720.0 120.0 Liabilities and Stockholders'Equity Current liabilities Accounts payable 60.0 72.0 12.0 Short-term debt 90.0 184.6 94.6 Total current liabilities 150.0 256.6 106.6 Long-term debt(8%interest bonds maturing in 20x7) 150.0 150.0 0.0 Stockholders'equity (I million shares outstanding) 300.0 313.4 13.4 Paid-in capital 200.0 200.0 0.0 Retained earnings 100.0 113.4 13.4 Total liabilities and equity 600.0 720.0 120.0 Other data:Market price per common share $200.0 $187.20 -$12.80 What difference would the B/S be if the GPC issues 50 million long-term debt? .THE COURSE OF FINANCE 2017 SPRING SJTU 7
GPC Balance Sheet on December 31 •THE COURSE OF FINANCE 2017 SPRING SJTU •7 What difference would the B/S be if the GPC issues 50 million long-term debt?
The Income Statement Summarizes the profitability of a company during a time period Major Divisions: Revenue cost of goods sold Gross margin=Revenue-COGS General administrative and selling expenses (GS&A) Operating income (or EBIT)=Gross margin-GS&A Debt service Taxable income=EBIT-Interest Corporate Taxes .mcoNet incomelaxable Income-Taxes=retained earnings +dividends
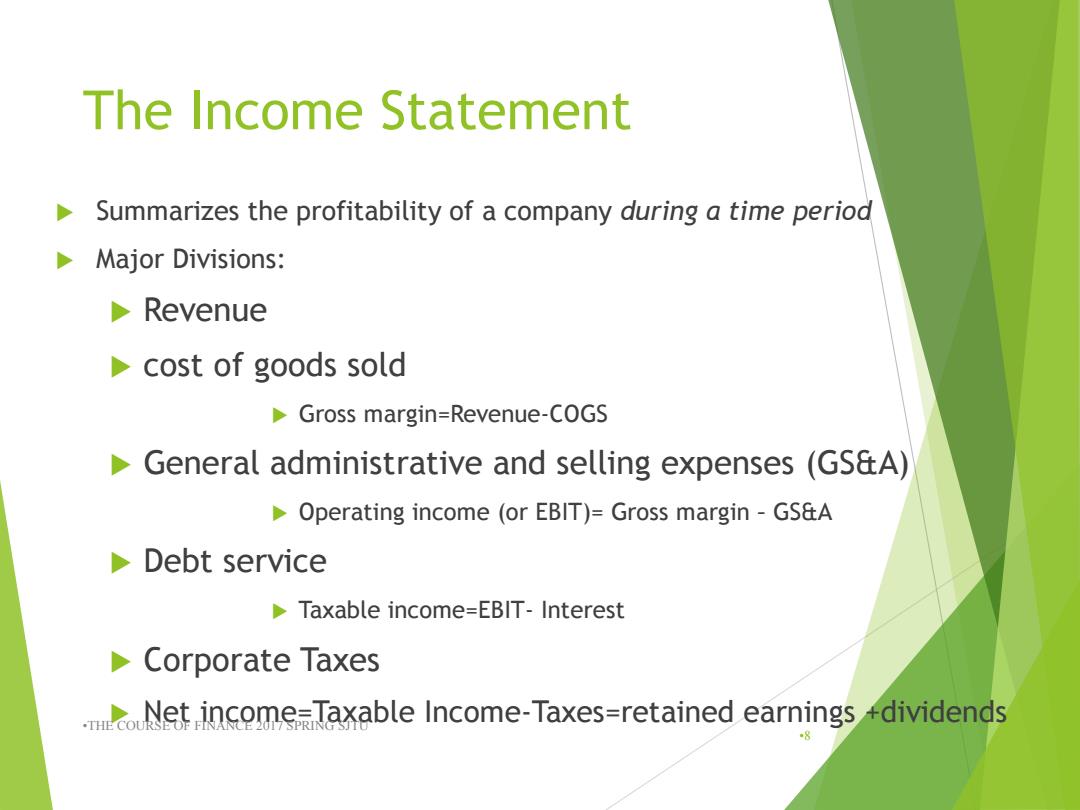
The Income Statement Summarizes the profitability of a company during a time period Major Divisions: Revenue cost of goods sold Gross margin=Revenue-COGS General administrative and selling expenses (GS&A) Operating income (or EBIT)= Gross margin – GS&A Debt service Taxable income=EBIT- Interest Corporate Taxes Net income=Taxable Income-Taxes=retained earnings +dividends •THE COURSE OF FINANCE 2017 SPRING SJTU •8
GPC Income Statement for Year Ending 2xx1 Sales revenues 200.0 Cost of goods sold (110.0) *Gross margin 90.0 Gen sell,admin exp (30.0) *Operating income 60.0 Interest expense (21.0) *Taxable income 39.0 Income tax (15.6) *Net income 23.4 Allocation to divs (10.0) .THE C *Chg retained earn 13.4
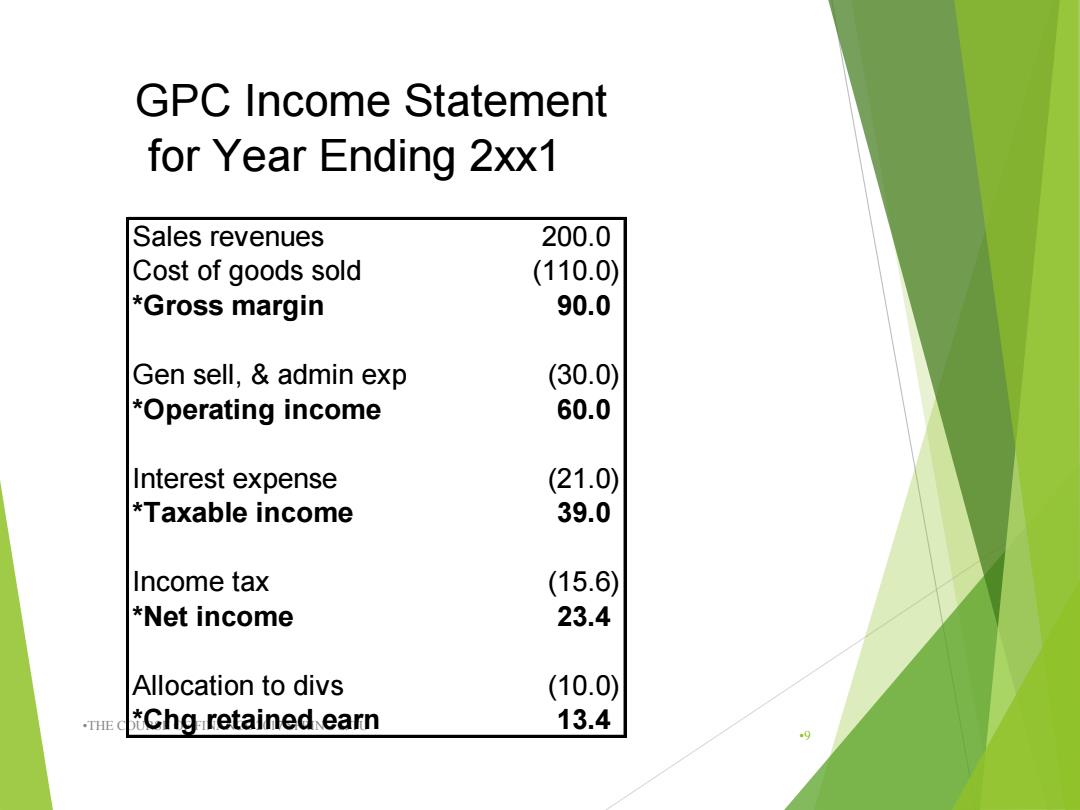
•THE COURSE OF FINANCE 2017 SPRING SJTU •9 GPC Income Statement for Year Ending 2xx1 Sales revenues 200.0 Cost of goods sold (110.0) *Gross margin 90.0 Gen sell, & admin exp (30.0) *Operating income 60.0 Interest expense (21.0) *Taxable income 39.0 Income tax (15.6) *Net income 23.4 Allocation to divs (10.0) *Chg retained earn 13.4

Important Reminders for the previous two sheets: Retained earnings as the connection btw.The Income Statement and the balance sheet Retained earnings are not added to the cash balance in the balance sheet, but are added to shareholder's equity Accounts show historical values,not market values The shareholder's equity may be much higher or lower than the market value of the firm The value of the firm's land may have halved or doubled,but this would not be reported in the balance sheet .THE COURSE OF FINANCE 2017 SPRING SJTU 10
Important Reminders for the previous two sheets: Retained earnings as the connection btw. The Income Statement and the balance sheet Retained earnings are not added to the cash balance in the balance sheet, but are added to shareholder’s equity Accounts show historical values, not market values The shareholder’s equity may be much higher or lower than the market value of the firm The value of the firm’s land may have halved or doubled, but this would not be reported in the balance sheet •THE COURSE OF FINANCE 2017 SPRING SJTU •10