Lecture 27 Thermal conductivity,Blood Perfusion Measurement
Lecture 27 Thermal conductivity, Blood Perfusion Measurement
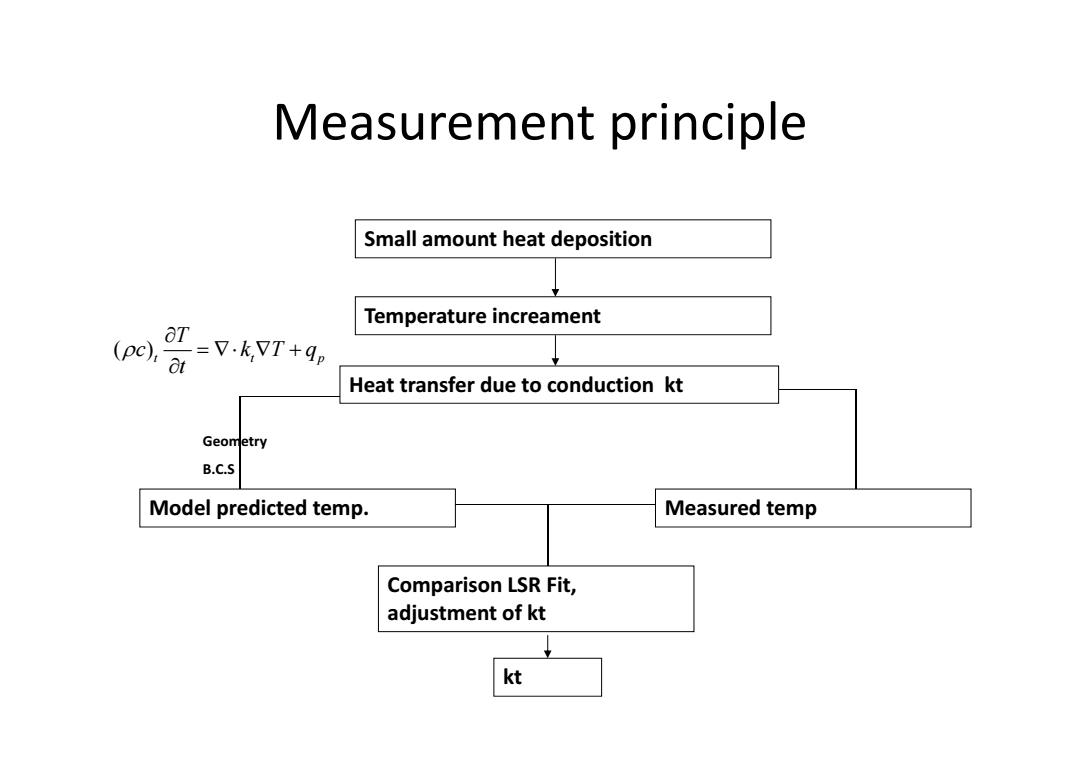
Measurement principle Small amount heat deposition Temperature increament =V.kVT+d, (pc).t Heat transfer due to conduction kt Geometry B.C.5 Model predicted temp. Measured temp Comparison LSR Fit, adjustment of kt kt
Measurement principle Small amount heat deposition Temperature increament Heat transfer due to conduction kt Model predicted temp. Measured temp Comparison LSR Fit, adjustment of kt kt Geometry B.C.S ( )t tp T c kTq t
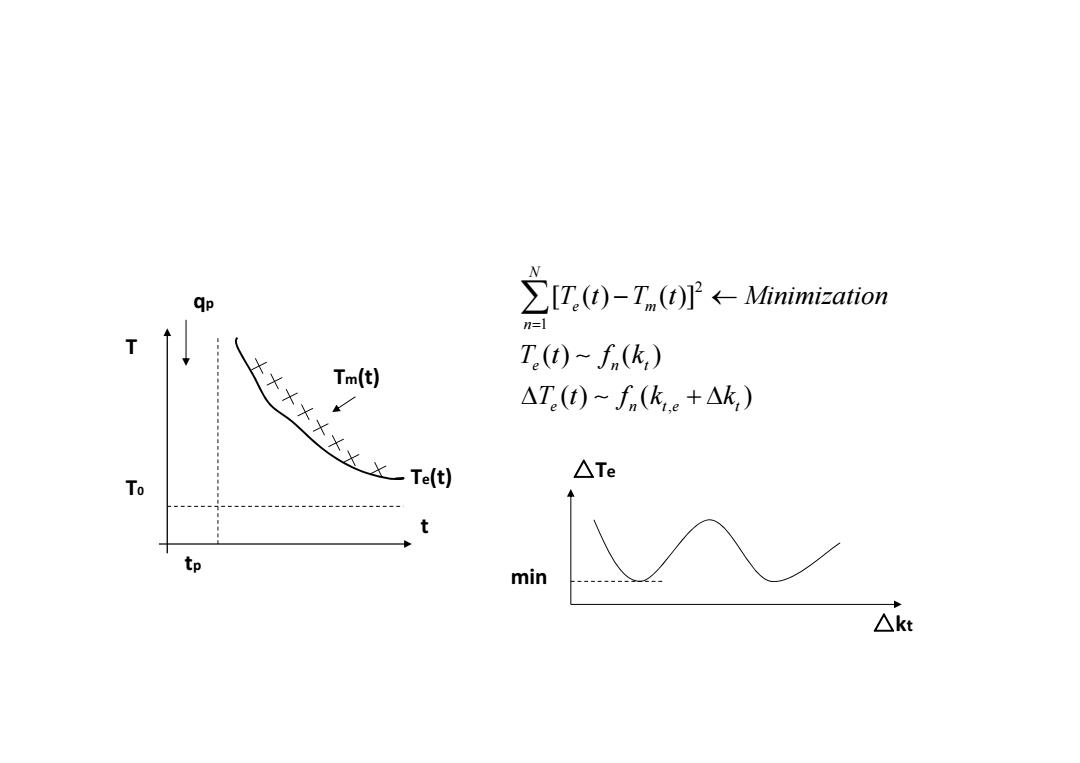
qp 之IU.0-T.oP←Minimi-ation n=1 T T.(t)-f(k) 之++大大子××一T(t) Tm(t) △T(t)~fn(ke+△k,) △Te To tp min △kt
2 1 , [ ( ) ( )] () ( ) () ( ) N e m n e nt e n te t T t T t Minimization Tt f k Tt f k k T T 0 t t p T e(t) q p T m(t) △ T e min △ kt
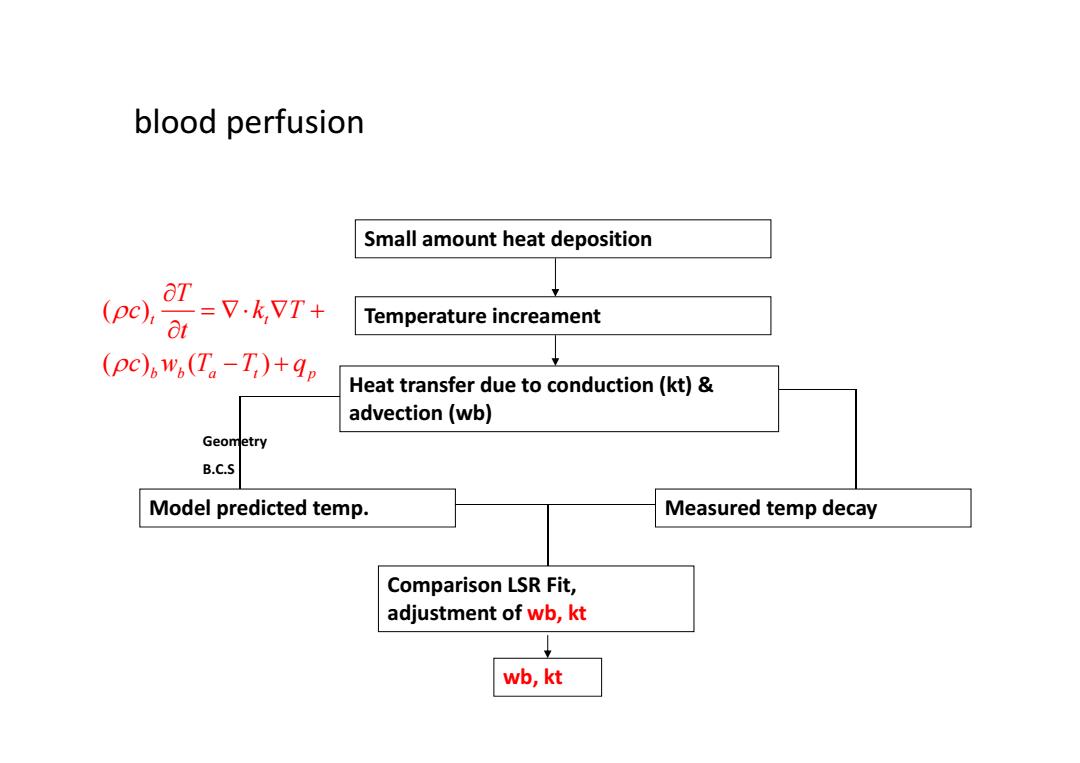
blood perfusion Small amount heat deposition (pc) =V.kVT+ 81 Temperature increament (pc)6",(T。-T,)+9p Heat transfer due to conduction(kt)& advection (wb) Geometry B.C.5 Model predicted temp. Measured temp decay Comparison LSR Fit, adjustment of wb,kt wb,kt
blood perfusion Small amount heat deposition Temperature increament Heat transfer due to conduction (kt) & advection (wb) Model predicted temp. Measured temp decay Comparison LSR Fit, adjustment of wb, kt wb, kt Geometry B.C.S ( ) () ( ) t t bb a t p T c kT t c wT T q

qp 之IC.(0-T.Or←Minimi-ation n=1 T T.(t)~f(kw) 之++大大×xT(t) Tm(t) △T(t)~fn(k.e+△k,wb.o+△w6) △Te To tp min △kt △wh
1 ,0 2 , [ ( ) ( )] ( ) ( ) , () ( ) , N e m n e n e n t b te t b b T t T t Minimi k w zation Tt f Tt f k kw w T T0 t tp Te(t) qp Tm(t) △Te min △kt △wb

Example:Thermal Plus Decay(TPD)method chen,Holmes &Arkin(1980) Heat source: Thermister bead microprobe Resistive heating Temp sensor (after the heating) R=R.enU吃宁 (Rpk is a reference resistance measured at Tk) 5mw p =35
Example: Thermal Plus Decay (TPD) method chen, Holmes &Arkin (1980) Heat source: • Thermister bead microprobe – Resistive heating – Temp sensor (after the heating) (Rpk is a reference resistance measured at Tk) 1 1 exp[ ( ) p pk p k R R T T Tp =3s 5mw
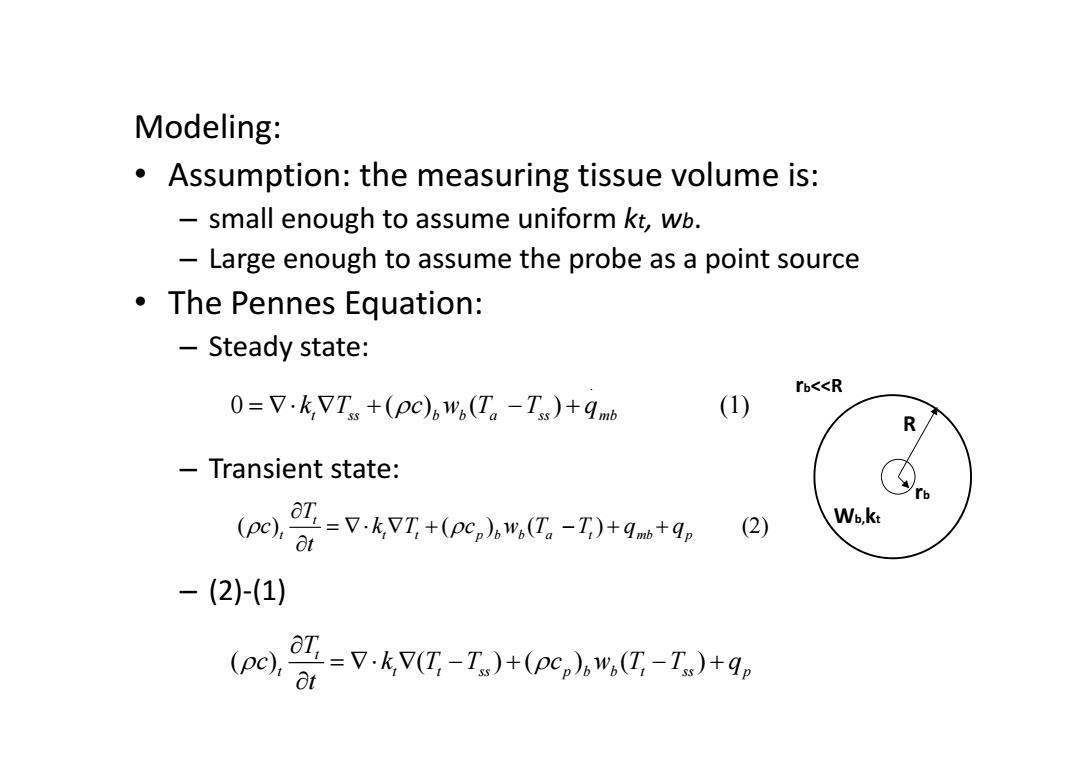
Modeling: Assumption:the measuring tissue volume is: small enough to assume uniform kt,wb. Large enough to assume the probe as a point source The Pennes Equation: Steady state: rb<<R 0=V·k7Ts+(pC)bw(T。-Ts)+9mb (1) R Transient state: L=7.kvT+(pc,w,亿。-I)+g+9。 (pc), (2) Wb,kt -(2)-(1) =7.k,V(T,-T)+(pc,b,(T,-T)+4p (pc):Ot
Modeling: • Assumption: the measuring tissue volume is: – small enough to assume uniform kt, wb. – Large enough to assume the probe as a point source • The Pennes Equation: – Steady state: – Transient state: – (2)‐(1) . 0 ( ) ( ) (1) t ss b b a ss mb k T c wT T q ( ) ( ) ( ) (2) t t t t pb b a t p mb T c k T c wT T q q t ( ) ( )( ) ( ) t t t t ss p b b t ss p T c k T T c wT T q t Wb,kt rb R rb<<R

if T-Ts=0 ~tissue temp elevation due to heating and(pc),≈(pc)b≈(pc)k,=const,.w。=const. 0=a-0-w,0+g, at pc then0r,t=0)=0;0r=o,t)=0; 9p=P.60) 0tp Carslaw Jaeger,1959 at anyt (r,t)=y(t-s)s.emads gp Y= 8π(pc)ax5 probe temp.r→0,t>tp)
Carslaw & Jaeger, 1959 2 1.5 / 4 ( ) ( ) 0 1.5 at any t ( , ) ( ) 8( ) probe temp. ( 0, ) p b t wts r ts p p r t t s e e ds q c r tt 2 ( ) ( ) ( ) , . 1 ( , 0) 0; ( , ) 0; (0) 0 0 t ss tb t b b p p p if T T tissue temp elevation due to heating and c c c k const w const w q t c rt r t then q P t tp q t tp
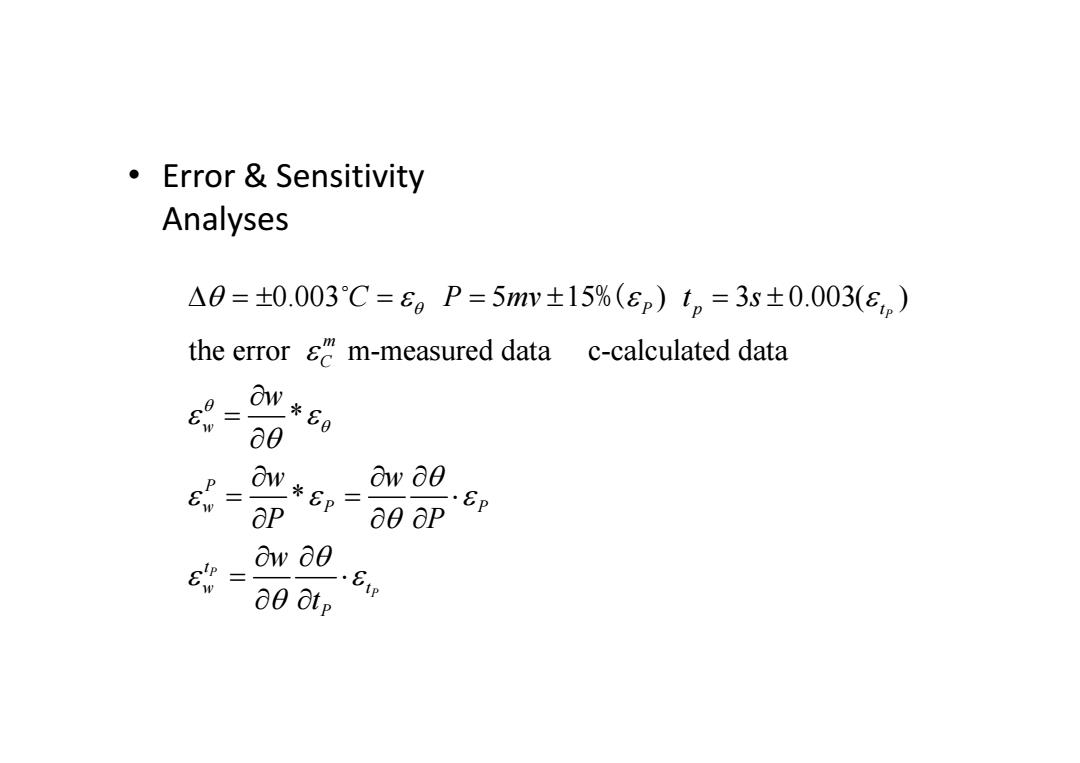
·Error&Sensitivity Analyses △0=±0.003C=6。P=5mw±15%(ep)t。=3s±0.003(εe) the error sm-measured data c-calculated data 6 N*89 a0 P Ow 80 E OW*p=00 OP ap .Ep ow 80 80 Otp .8
• Error & Sensitivity Analyses 0.003 5 15 ) 3 0.003( ) the error m-measured data c-calculated data * * P P P Pp t m C w P wP P t w t P C P mv t s w w w P P w t %(