Air and Air Pollution Prof.JIANG Dahe de Nevers,N.1995:Air Pollution Control Engineering, McGraw-Hill Elsom,D.M.1992:Atmospheric Pollution-A Global Problem,2nd Ed.,Blackwell J.Glynn Henry and Gary W.Heinke 1989,Environmental Science and Engineering,Prentice-Hall
Air and Air Pollution Prof. JIANG Dahe de Nevers, N. 1995: Air Pollution Control Engineering, McGraw-Hill Elsom, D. M. 1992: Atmospheric Pollution - A Global Problem, 2nd Ed., Blackwell J. Glynn Henry and Gary W. Heinke 1989, Environmental Science and Engineering, Prentice-Hall

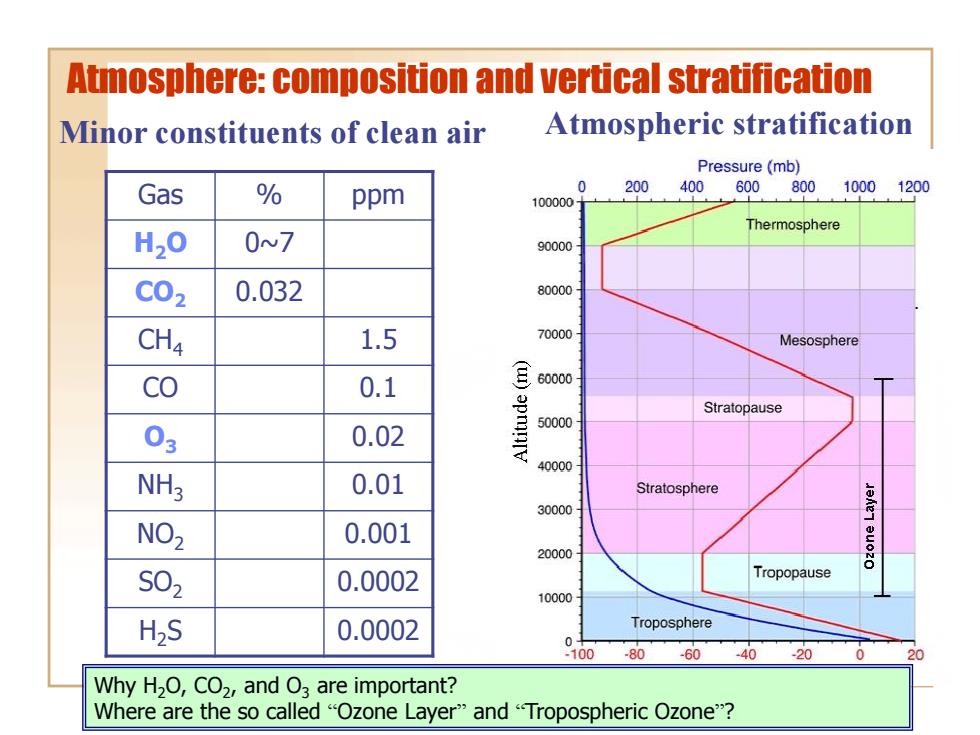
Atmosphere:composition and vertical stratification Minor constituents of clean air Atmospheric stratification Pressure(mb) Gas % ppm 0 200 400,600,80010001200 100000 Thermosphere H20 0N7 90000 C02 0.032 80000 CH4 1.5 70000 Mesosphere cO 0.1 E6000- 03 0.02 apmnIV Stratopause 50000 40000 NH3 0.01 Stratosphere 30000 NO 0.001 20000 S02 0.0002 Tropopause 10000 H>S 0.0002 Troposphere 0 100 -80 -60 -40 -20 20 Why H2O,CO2,and O are important? Where are the so called "Ozone Layer"and "Tropospheric Ozone"?
Atmosphere: composition and vertical stratification Gas % ppm H2O 0~7 CO2 0.032 CH4 1.5 CO 0.1 O3 0.02 NH3 0.01 NO2 0.001 SO2 0.0002 H2S 0.0002 Minor constituents of clean air Atmospheric stratification Why H2O, CO2 , and O3 are important? Where are the so called “Ozone Layer” and “Tropospheric Ozone”?

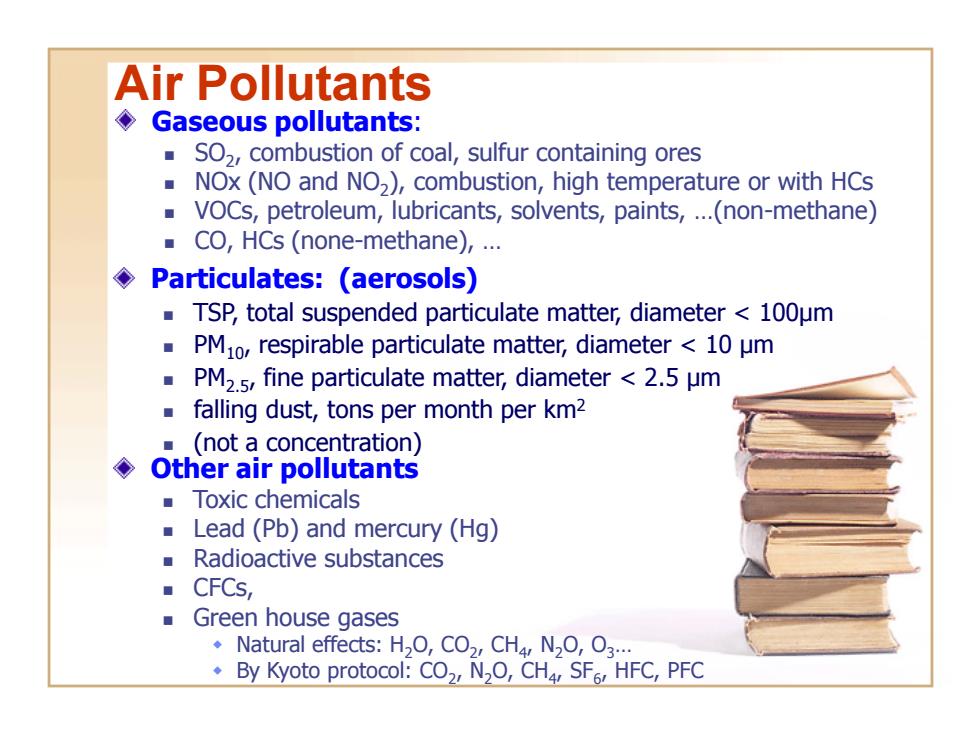
Air Pollutants ◆ Gaseous pollutants: SO2,combustion of coal,sulfur containing ores NOx(NO and NO,),combustion,high temperature or with HCs VOCs,petroleum,lubricants,solvents,paints,...(non-methane) CO,HCs (none-methane),... Particulates:(aerosols) TSP,total suspended particulate matter,diameter 100um PM1o,respirable particulate matter,diameter 10 um PM2.5,fine particulate matter,diameter 2.5 um falling dust,tons per month per km2 (not a concentration) ◆ Other air pollutants ■Toxic chemicals Lead (Pb)and mercury (Hg) Radioactive substances ■CFCs, ■Green house gases Natural effects:H2O,CO,CH4,N2O,O3... .By Kyoto protocol:CO2,N2O,CH4 SF6,HFC,PFC
Air Pollutants Gaseous pollutants: SO2 , combustion of coal, sulfur containing ores NOx (NO and NO2 ), combustion, high temperature or with HCs VOCs, petroleum, lubricants, solvents, paints, …(non-methane) CO, HCs (none-methane), … Particulates: (aerosols) TSP, total suspended particulate matter, diameter < 100μm PM10, respirable particulate matter, diameter < 10 μm PM2.5, fine particulate matter, diameter < 2.5 μm falling dust, tons per month per km2 (not a concentration) Other air pollutants Toxic chemicals Lead (Pb) and mercury (Hg) Radioactive substances CFCs, Green house gases Natural effects: H2O, CO2 , CH4 , N2O, O3… By Kyoto protocol: CO2 , N2O, CH4 , SF6 , HFC, PFC

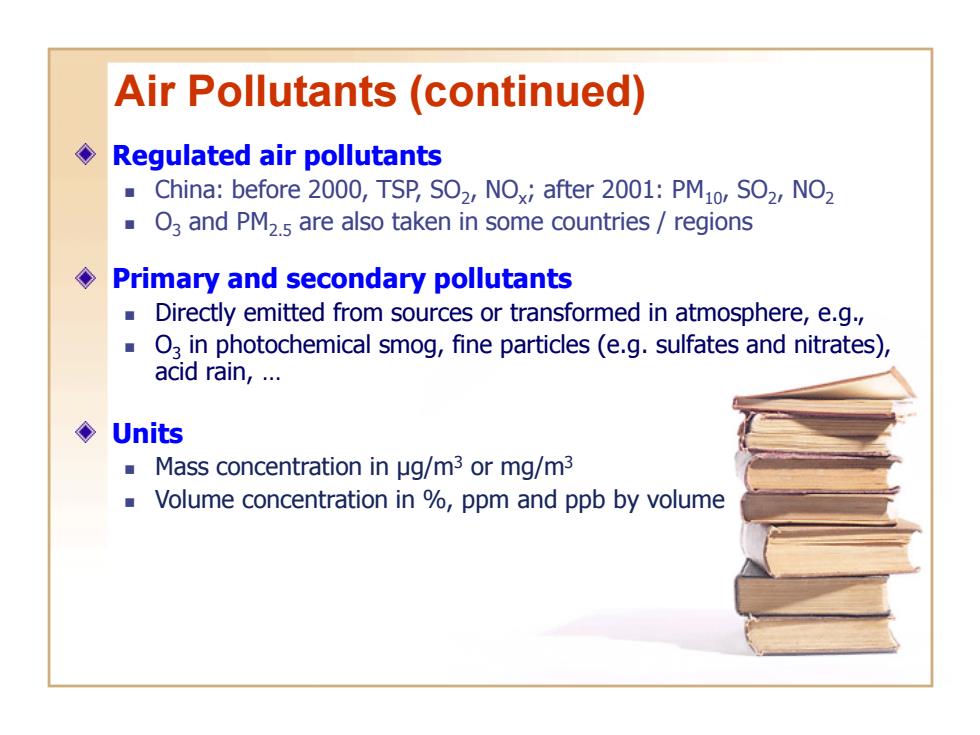
Air Pollutants (continued) ◆ Regulated air pollutants China:before 2000,TSP,SO2,NOx;after 2001:PM1o,SO2,NO2 O3 and PM2.5 are also taken in some countries/regions Primary and secondary pollutants Directly emitted from sources or transformed in atmosphere,e.g. O in photochemical smog,fine particles (e.g.sulfates and nitrates), acid rain,... ◆Units ■Mass concentration inμg/m3ormg/m3 Volume concentration in %ppm and ppb by volume
Air Pollutants (continued) Regulated air pollutants China: before 2000, TSP, SO2 , NOx ; after 2001: PM10, SO2 , NO2 O3 and PM2.5 are also taken in some countries / regions Primary and secondary pollutants Directly emitted from sources or transformed in atmosphere, e.g., O3 in photochemical smog, fine particles (e.g. sulfates and nitrates), acid rain, … Units Mass concentration in μg/m3 or mg/m3 Volume concentration in %, ppm and ppb by volume

Air Quality Standards To establish ambient air quality standards Physical/chemical/biological analysis; ■Animal experiments, Short-term exposure of human volunteers(observe measurable,irreversible short-term or long-term effects); Epidemiology
Air Quality Standards To establish ambient air quality standards Physical/chemical/biological analysis; Animal experiments; Short-term exposure of human volunteers (observe measurable, irreversible short-term or long-term effects); Epidemiology

US National Ambient Air Quality Standards Pollutant Averaging time Primary(μg/m3) Secondary(μg/m3) S02 Annual arithmetic mean 80(0.03ppm) 24hr 365(0.14ppm) PM10 Annual 50* 24hr 150 PM2s* Annual 15* 24hr 65* CO 8hr 10(mg/m3) 1hr 40(mg/m3,35ppm) HCs 3hr 160(0.24ppm) (corrected for methane) NO Annual 100(0.05ppm) Pb 3 months 1.5 03 8hr 80*
Pollutant Averaging time Primary (g/m3 ) Secondary(g/m3 ) SO2 Annual arithmetic mean 80 (0.03 ppm) 24 hr 365 (0.14 ppm) PM10 Annual 50* 24 hr 150 PM2.5 * Annual 15* 24 hr 65* CO 8 hr 10(mg/m3 ) 1 hr 40 (mg/m3 , 35 ppm) HCs (corrected for methane) 3 hr 160 (0.24 ppm) NOx Annual 100 (0.05 ppm) Pb 3 months 1.5 O3 8 hr 80* US National Ambient Air Quality Standards

China National Ambient Air Quality Standards(GB 3095-1996) Pollutant Average period Concentration First class Second class Third class Unit annually 0.02 0.06 0.10 Sulfur dioxide SO, daily 0.05 0.15 0.25 hourly 0.15 0.50 0.70 Total suspended annually 0.08 0.20 0.30 particulates TSP daily 0.12 0.30 0.50 Respirable annually 0.04 0.10 0.15 particulates PMo daily 0.05 0.15 0.25 annually 0.05 0.05 0.10 Nitrogen oxides daily 0.10 0.10 0.15 mg/m3 NOx (Standard state) hourly 0.15 0.15 0.30 0.04 0.08 Nitrogen dioxide annually 0.04 daily 0.08 0.08 0.12 NO2 hourly 0.12 0.12 0.24 Carbon oxide CO daily 4.00 4.00 6.00 hourly 10.00 10.00 20.00 Ozone O3 hourly 0.12 0.16 0.20 Lead Pb seasonally 1.50 annually 1.00 苯并[a芘B[aP daily 0.01 ug/m3 (Standard state) daily 70 Fluorides hourly 200 1.8② F monthly 3.03 Plant growing seas. 1.22 2.0③ ug/(dm2-d)
Pollutant Average period Concentration First class Second class Third class Unit Sulfur dioxide SO2 annually daily hourly 0.02 0.05 0.15 0.06 0.15 0.50 0.10 0.25 0.70 Total suspended particulates TSP annually daily 0.08 0.12 0.20 0.30 0.30 0.50 Respirable particulates PM10 annually daily 0.04 0.05 0.10 0.15 0.15 0.25 Nitrogen oxides NOx annually daily hourly 0.05 0.10 0.15 0.05 0.10 0.15 0.10 0.15 0.30 mg/m3 (Standard state) Nitrogen dioxide NO2 annually daily hourly 0.04 0.08 0.12 0.04 0.08 0.12 0.08 0.12 0.24 Carbon oxide CO daily hourly 4.00 10.00 4.00 10.00 6.00 20.00 Ozone O3 hourly 0.12 0.16 0.20 Lead Pb seasonally annually 1.50 1.00 苯并[a]芘B[a]P daily 0.01 μg/m3 (Standard state) Fluorides daily hourly 7① 20① F monthly Plant growing seas. 1.8② 1.2② 3.0③ 2.0③ μg/(dm2·d) China National Ambient Air Quality Standards (GB 3095-1996 )

Air Pollution Index (API) ◆Why API? Easier understanding of public; Consistent description among regulated pollutants
Air Pollution Index (API) Why API? Easier understanding of public; Consistent description among regulated pollutants

Air Pollution Index (API) Air Pollution Index(API)was introduced by US as Pollutant Standard Index(PSI)in 1972,and currently is referred to as Air Quality Index(AQI). API system of Shanghai Class I Ⅱ IV API Range 0-5051-100 101-200 201-300 >300 Description Good Fair Lightly Polluted Heavily polluted polluted 00 400 20 PM10(mg/m3) 3 0.4 0.5
Air Pollution Index (API) Air Pollution Index (API) was introduced by US as Pollutant Standard Index (PSI) in 1972, and currently is referred to as Air Quality Index (AQI). API system of Shanghai Class I II III IV V API Range 0-50 51-100 101-200 201-300 >300 Description Good Fair Lightly polluted Polluted Heavily polluted

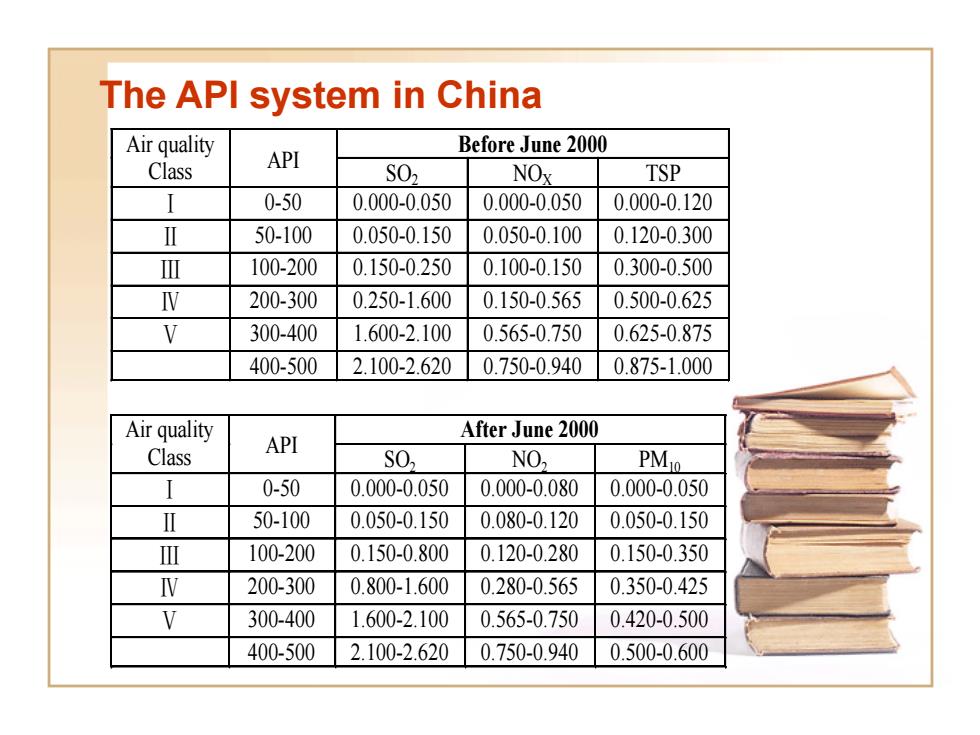
The API system in China Air quality Before June 2000 Class API S02 NOx TSP I 0-50 0.000-0.050 0.000-0.050 0.000-0.120 Ⅱ 50-100 0.050-0.150 0.050-0.100 0.120-0.300 Ⅲ 100-200 0.150-0.250 0.100-0.150 0.300-0.500 V 200-300 0.250-1.600 0.150-0.565 0.500-0.625 V 300-400 1.600-2.100 0.565-0.750 0.625-0.875 400-500 2.100-2.620 0.750-0.940 0.875-1.000 Air quality After June 2000 Class API S02 NO2 PMio I 0-50 0.000-0.050 0.000-0.080 0.000-0.050 Ⅱ 50-100 0.050-0.150 0.080-0.120 0.050-0.150 Ⅲ 100-200 0.150-0.800 0.120-0.280 0.150-0.350 N 200-300 0.800-1.600 0.280-0.565 0.350-0.425 V 300-400 1.600-2.100 0.565-0.750 0.420-0.500 400-500 2.100-2.620 0.750-0.940 0.500-0.600
The API system in China Air quality Class API Before June 2000 SO2 NOX TSP Ⅰ 0-50 0.000-0.050 0.000-0.050 0.000-0.120 Ⅱ 50-100 0.050-0.150 0.050-0.100 0.120-0.300 Ⅲ 100-200 0.150-0.250 0.100-0.150 0.300-0.500 Ⅳ 200-300 0.250-1.600 0.150-0.565 0.500-0.625 Ⅴ 300-400 1.600-2.100 0.565-0.750 0.625-0.875 400-500 2.100-2.620 0.750-0.940 0.875-1.000 Air quality After June 2000 Class API SO2 NO2 PM10 Ⅰ 0-50 0.000-0.050 0.000-0.080 0.000-0.050 Ⅱ 50-100 0.050-0.150 0.080-0.120 0.050-0.150 Ⅲ 100-200 0.150-0.800 0.120-0.280 0.150-0.350 Ⅳ 200-300 0.800-1.600 0.280-0.565 0.350-0.425 Ⅴ 300-400 1.600-2.100 0.565-0.750 0.420-0.500 400-500 2.100-2.620 0.750-0.940 0.500-0.600