Chapter 12 Time series based Demand Management Session 12-1
McGraw-Hill/Irwin Session 12-1 Chapter 12 Time series based Demand Management

OBJECTIVES Demand Management 动 Qualitative Forecasting Methods n Time Series Analysis Static method -Adaptive method Simple Weighted Moving Average Forecasts Exponential Smoothing Exponential Smoothing with trend Exponential Smoothing with trend seasonality Simple Linear Regression Session 12-2
McGraw-Hill/Irwin Session 12-2 Demand Management Qualitative Forecasting Methods Time Series Analysis – Static method – Adaptive method Simple & Weighted Moving Average Forecasts Exponential Smoothing Exponential Smoothing with trend Exponential Smoothing with trend & seasonality Simple Linear Regression OBJECTIVES

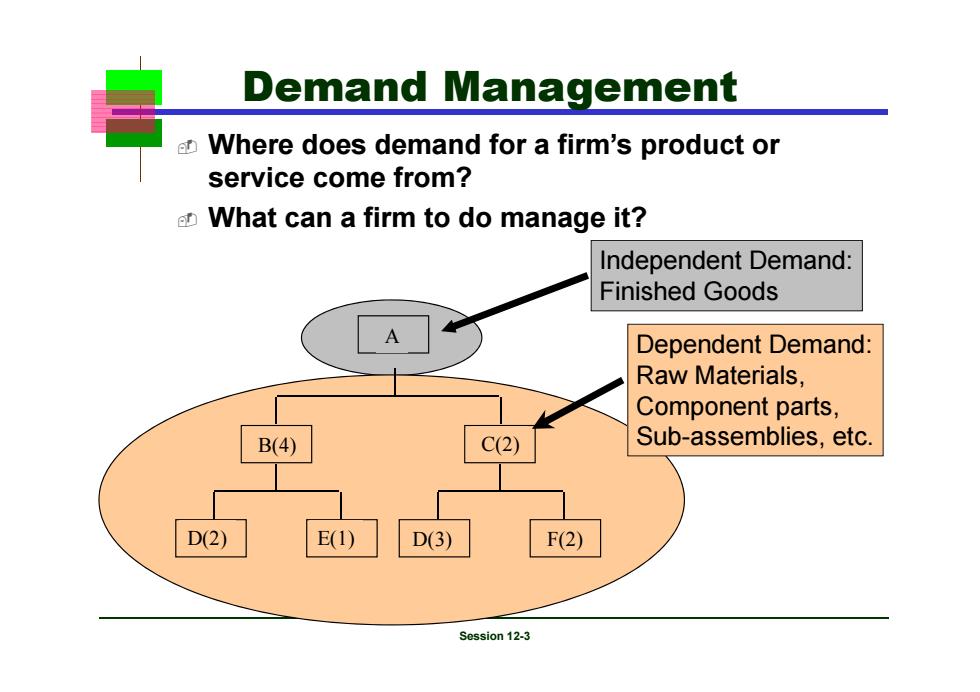
Demand Management Where does demand for a firm's product or service come from? What can a firm to do manage it? Independent Demand: Finished Goods A Dependent Demand: Raw Materials, Component parts, C(2) Sub-assemblies,etc. D(2) E(1) D(3) F(2) Session 12-3
McGraw-Hill/Irwin Session 12-3 Demand Management A B(4) C(2) D(2) E(1) D(3) F(2) Dependent Demand: Raw Materials, Component parts, Sub-assemblies, etc. Independent Demand: Finished Goods Where does demand for a firm’s product or service come from? What can a firm to do manage it?

Independent Demand What a firm can do to manage it? Can take an active role to influence demand Can take a passive role and simply respond to demand Session 12-4
McGraw-Hill/Irwin Session 12-4 Independent Demand What a firm can do to manage it? Can take an active role to influence demand Can take a passive role and simply respond to demand

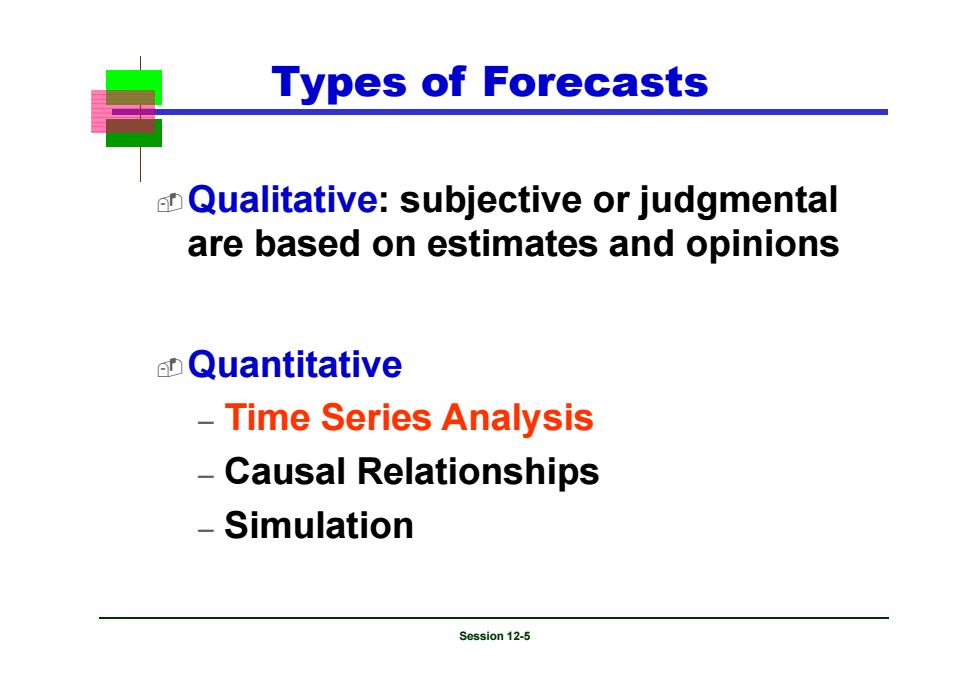
Types of Forecasts Qualitative:subjective or judgmental are based on estimates and opinions Quantitative Time Series Analysis Causal Relationships Simulation Session 12-5
McGraw-Hill/Irwin Session 12-5 Types of Forecasts Qualitative: subjective or judgmental are based on estimates and opinions Quantitative – Time Series Analysis – Causal Relationships – Simulation

Forecasting Techniques and Common Models Qualitative Grass Roots:derives a forecast by compiling input from those at the end of the hierarchy who deal with what is being forecast. Market Research:sets out to collect data in a variety of ways (surveys,interviews)to test hypotheses about the market. Panel Consensus:free open exchange at meetings. Historical Analogy:ties what is being forecast to a similar item Delphi Method:Group of experts responds to questionnaire Session 12-6
McGraw-Hill/Irwin Session 12-6 Forecasting Techniques and Common Models Qualitative – Grass Roots: derives a forecast by compiling input from those at the end of the hierarchy who deal with what is being forecast. – Market Research: sets out to collect data in a variety of ways (surveys, interviews) to test hypotheses about the market. – Panel Consensus: free open exchange at meetings. – Historical Analogy: ties what is being forecast to a similar item – Delphi Method: Group of experts responds to questionnaire

Delphi Method I.Choose the experts to participate representing a variety of knowledgeable people in different areas 2.Through a questionnaire (or E-mail),obtain forecasts(and any premises or qualifications for the forecasts)from all participants 3.Summarize the results and redistribute them to the participants along with appropriate new questions 4.Summarize again,refining forecasts and conditions,and again develop new questions 5.Repeat Step 4 as necessary and distribute the final results to all participants Session 12-7
McGraw-Hill/Irwin Session 12-7 Delphi Method l. Choose the experts to participate representing a variety of knowledgeable people in different areas 2. Through a questionnaire (or E-mail), obtain forecasts (and any premises or qualifications for the forecasts) from all participants 3. Summarize the results and redistribute them to the participants along with appropriate new questions 4. Summarize again, refining forecasts and conditions, and again develop new questions 5. Repeat Step 4 as necessary and distribute the final results to all participants

Forecasting Techniques and Common Models (Cont'd】 Time Series Analysis Simple Moving Average:a time period containing a number of data points is averaged by dividing the sum of the point values by the number of points. Weighted Moving Average:specific points may be weighted more or less than the others,as seen fit by experience Exponential Smoothing:recent data points are weighted more with weighting declining exponentially as data become older. Regression analysis:fits a straight line to past data generally relating the data value to time. Box Jenkins Technique:Relates a class of statistical models to data and fits the model to the time series by using Bayesian posterior distributions Session 12-8
McGraw-Hill/Irwin Session 12-8 Time Series Analysis – Simple Moving Average: a time period containing a number of data points is averaged by dividing the sum of the point values by the number of points. – Weighted Moving Average: specific points may be weighted more or less than the others, as seen fit by experience – Exponential Smoothing: recent data points are weighted more with weighting declining exponentially as data become older. – Regression analysis: fits a straight line to past data generally relating the data value to time. – Box Jenkins Technique: Relates a class of statistical models to data and fits the model to the time series by using Bayesian posterior distributions Forecasting Techniques and Common Models (Cont’d)

Forecasting Techniques and Common Models (Cont'd) Causal Relationships Regression Analysis:similar to least squares method in times series but may contain multiple variables 一 Econometric Models:attempts to describe some sector of the economy by a series of interdependent equations 一 Input/output Models:focuses on sales of each industry to other firms and governments.Indicates the changes in sales that a producer industry might expect because of purchasing changes by another industry Leading Indicators:Statistics that move in the same direction as the series being forecast but move before the series. Session12-9
McGraw-Hill/Irwin Session 12-9 Causal Relationships – Regression Analysis: similar to least squares method in times series but may contain multiple variables – Econometric Models: attempts to describe some sector of the economy by a series of interdependent equations – Input/output Models: focuses on sales of each industry to other firms and governments. Indicates the changes in sales that a producer industry might expect because of purchasing changes by another industry – Leading Indicators: Statistics that move in the same direction as the series being forecast but move before the series. Forecasting Techniques and Common Models (Cont’d)

Forecasting Techniques and Common Models (Cont'd) Simulation Models:Dynamic models, usually computer-based,that allow the forecaster to make assumptions about the internal variables and external environment in the model. -Depending on the variables in the model,the forecaster may ask such questions as.What would happen to my forecast if price increased by 10 percent?What effect would a mild national recession have on my forecast? Session 12-10
McGraw-Hill/Irwin Session 12-10 Simulation Models: Dynamic models, usually computer-based, that allow the forecaster to make assumptions about the internal variables and external environment in the model. – Depending on the variables in the model, the forecaster may ask such questions as. What would happen to my forecast if price increased by 10 percent? What effect would a mild national recession have on my forecast? Forecasting Techniques and Common Models (Cont’d)