Statistics for Managers Using Microsoft Excel Chapter 9 Two-Sample Tests Statistics for Managers Using Microsoft Excel Chap 9-1
Statistics for Managers Using Microsoft Excel Chap 9-1 Chapter 9 Two-Sample Tests Statistics for Managers Using Microsoft Excel
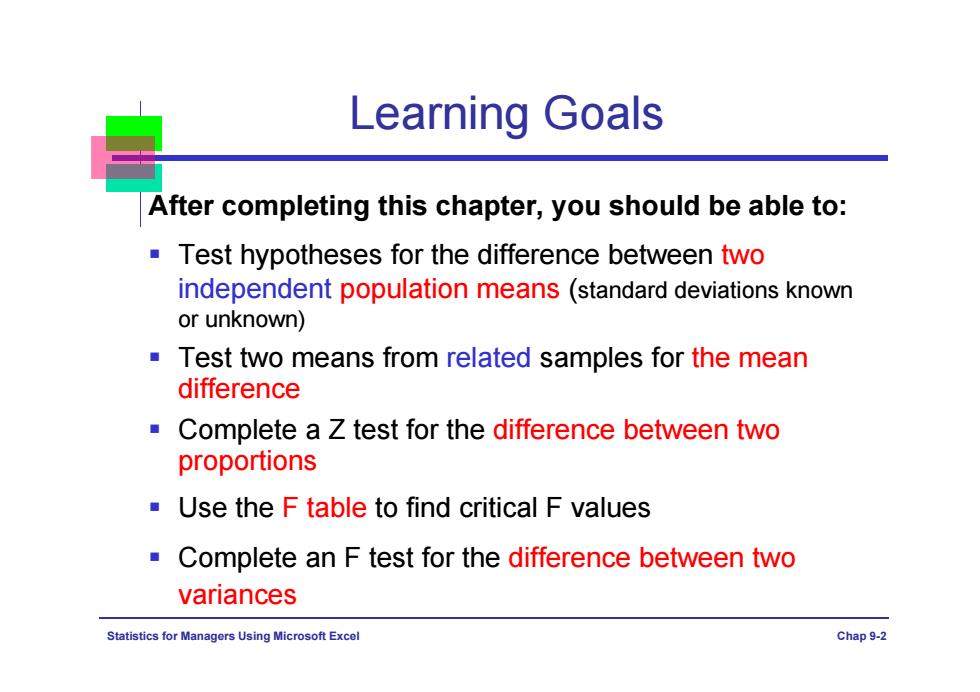
Learning Goals After completing this chapter,you should be able to: Test hypotheses for the difference between two independent population means(standard deviations known or unknown) Test two means from related samples for the mean difference Complete a Z test for the difference between two proportions Use the F table to find critical F values Complete an F test for the difference between two variances Statistics for Managers Using Microsoft Excel Chap9-2
Statistics for Managers Using Microsoft Excel Chap 9-2 Learning Goals After completing this chapter, you should be able to: Test hypotheses for the difference between two independent population means (standard deviations known or unknown) Test two means from related samples for the mean difference Complete a Z test for the difference between two proportions Use the F table to find critical F values Complete an F test for the difference between two variances
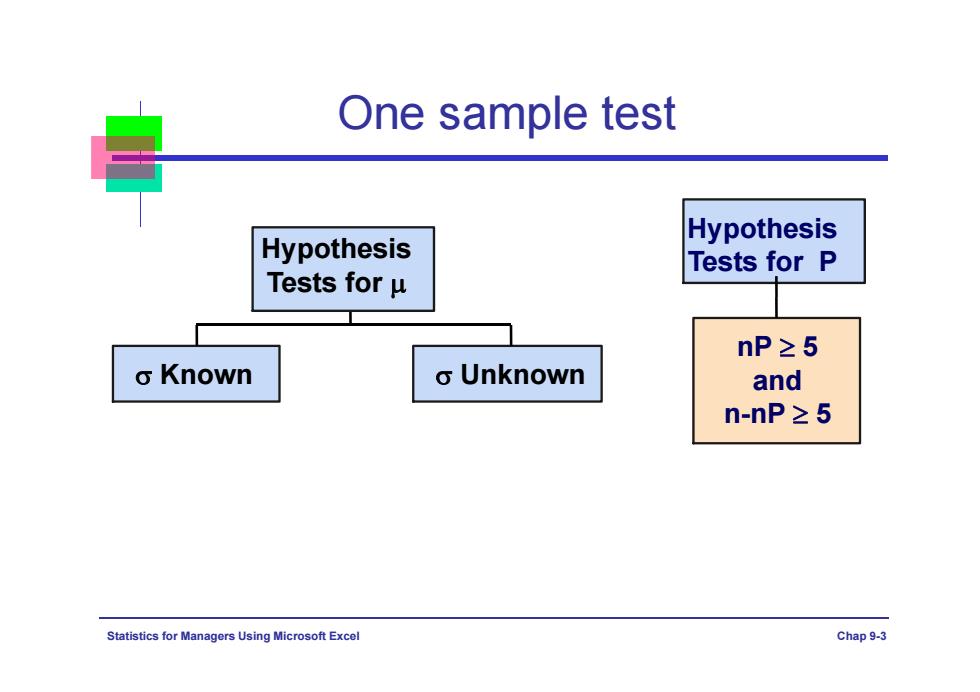
One sample test Hypothesis Hypothesis Tests for P Tests for u nP≥5 o Known o Unknown and n-nP≥5 Statistics for Ma nagers Using Microsoft Excel Chap 9-3
Statistics for Managers Using Microsoft Excel Chap 9-3 One sample test Known Unknown Hypothesis Tests for nP 5 and n-nP 5 Hypothesis Tests for P

Ho Condition Test H Rejection Statistic Area One u丰0 IZZan sample X-40 population 02 oln u0 ZzLa One 02 u≠o t>ta/2(n-1) sample unknown t= 又- population SIn u40 t>i(n-1) hp≥5, P,卡p IZZan One Z= ps-p and sample p1-p) 卫.Za
n X Z / 0 μ ≠ μ 0 μ > μ 0 μ μ 0 μ p / 2 | | Z Z Z Z Z Z One sample population P = p ( 1 ) 5 and 5, n p np n p p p p Z s ( 1 ) ps < p ps ≠ p
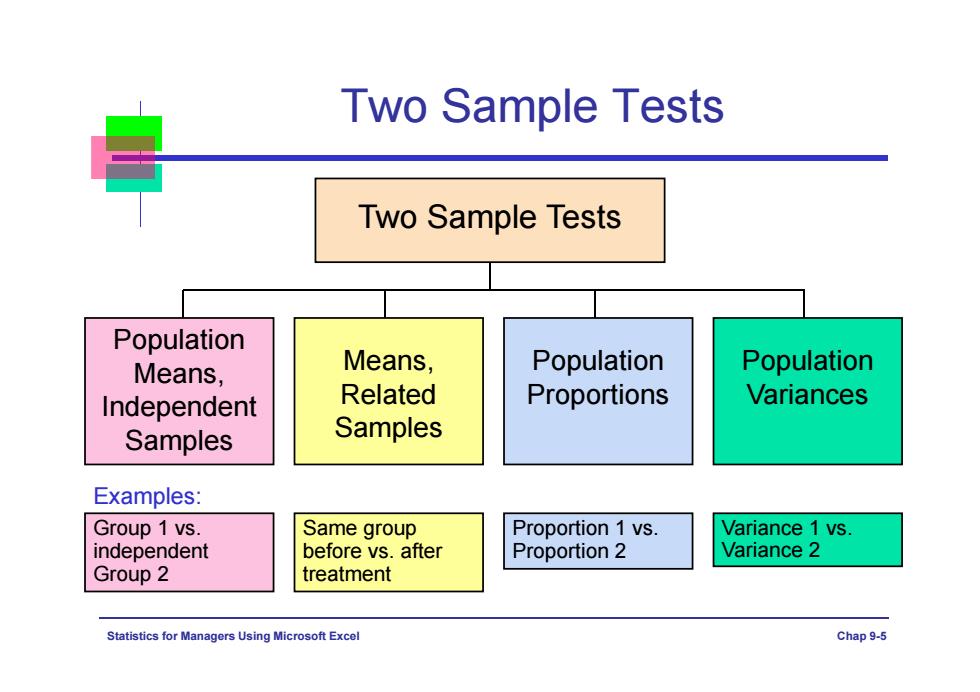
Two Sample Tests Two Sample Tests Population Means, Means, Population Population Independent Related Proportions Variances Samples Samples Examples: Group 1 vs. Same group Proportion 1 vs. Variance 1 vs. independent before vs.after Proportion 2 Variance 2 Group 2 treatment Statistics for Ma agers Using Microsoft Excel Chap 9-5
Statistics for Managers Using Microsoft Excel Chap 9-5 Two Sample Tests Two Sample Tests Population Means, Independent Samples Means, Related Samples Population Variances Group 1 vs. independent Group 2 Same group before vs. after treatment Variance 1 vs. Variance 2 Examples: Population Proportions Proportion 1 vs. Proportion 2
Difference Between Two Means Population means, Goal:Test hypothesis or form independent a confidence interval for the samples difference between two population means,.μ1-μ2 o1 and o2 known The point estimate for the o,and o2 unknown difference is X1-X2 Statistics for Managers Using Microsoft Excel Chap9-6
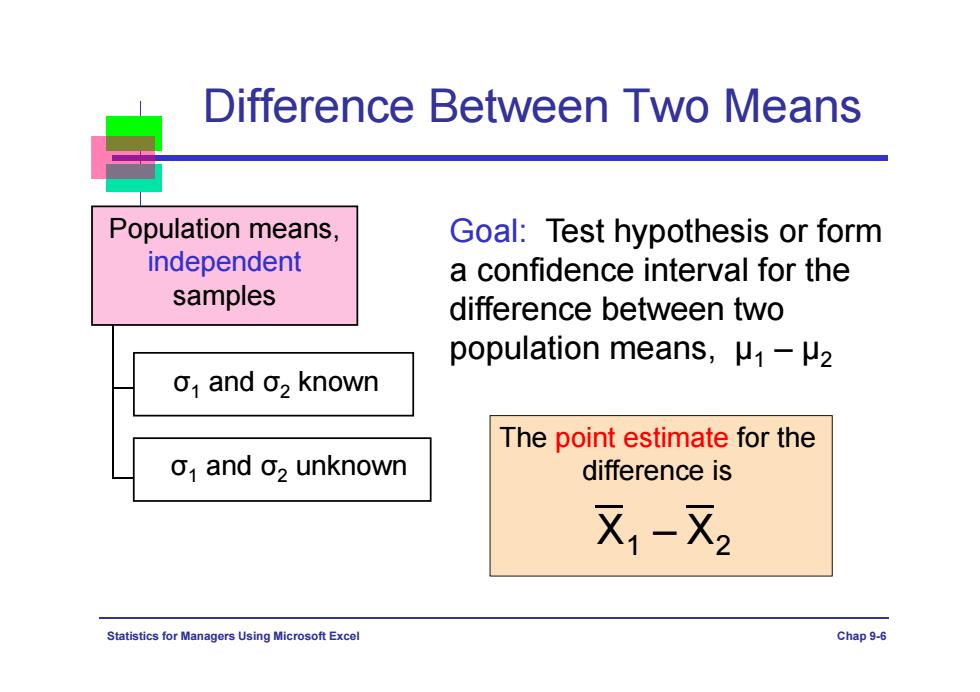
Statistics for Managers Using Microsoft Excel Chap 9-6 Difference Between Two Means Population means, independent samples σ1 and σ2 known σ1 and σ2 unknown Goal: Test hypothesis or form a confidence interval for the difference between two population means, μ1 – μ2 The point estimate for the difference is X1 – X2
Independent Samples Population means, Different data sources independent Unrelated samples ·Independent -Sample selected from one population has no effect on o1 and o2 known the sample selected from the other population Use the difference between 2 o1 and o2 unknown sample means Use Z test or pooled variance t test Statistics for Managers Using Microsoft Excel Chap9-7
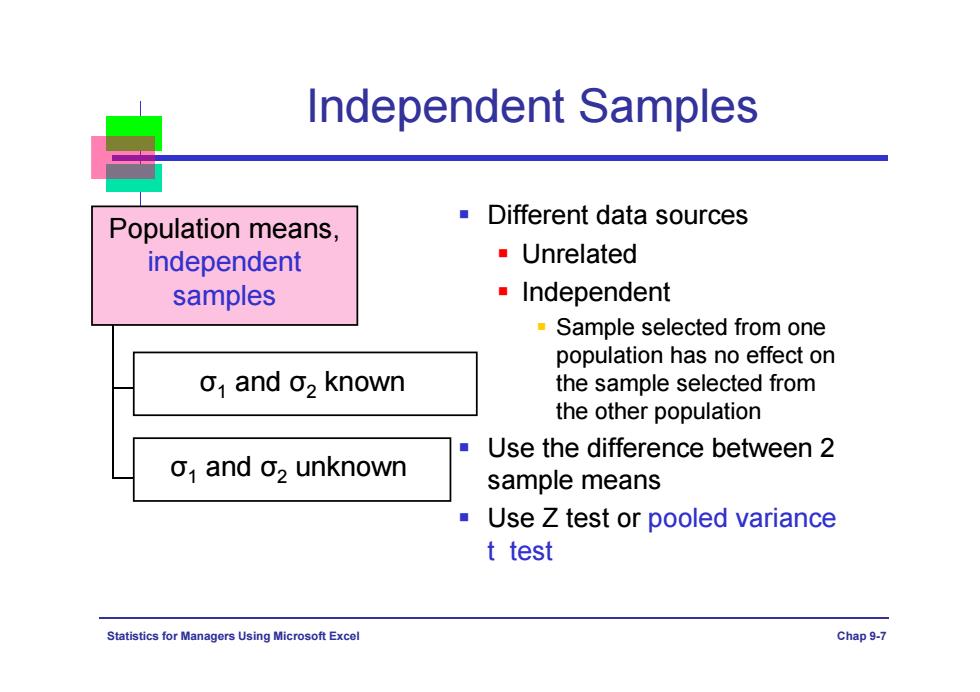
Statistics for Managers Using Microsoft Excel Chap 9-7 Independent Samples Population means, independent samples Different data sources Unrelated Independent Sample selected from one population has no effect on the sample selected from the other population Use the difference between 2 sample means Use Z test or pooled variance t test σ1 and σ2 known σ1 and σ2 unknown
Difference Between Two Means Population means, independent samples o and 02 known Use a z test statistic Use S to estimate unknown o, o,and o2 unknown use a t test statistic and pooled standard deviation Statistics for Managers Using Microsoft Excel Chap9-8
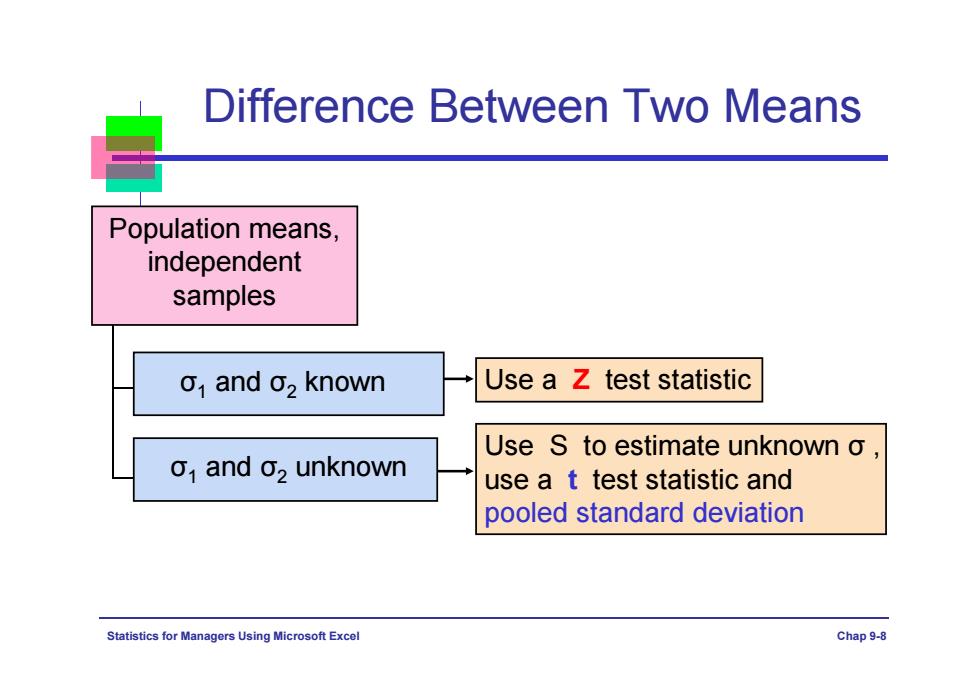
Statistics for Managers Using Microsoft Excel Chap 9-8 Difference Between Two Means Population means, independent samples σ1 and σ2 known σ1 and σ2 unknown Use a Z test statistic Use S to estimate unknown σ , use a t test statistic and pooled standard deviation
o,and o,Known Population means, Assumptions: independent samples Samples are randomly and independently drawn o and 02 known population distributions are normal or both sample sizes o1 and o2 unknown are≥30 Population standard deviations are known Statistics for Managers Using Microsoft Excel Chap9-9
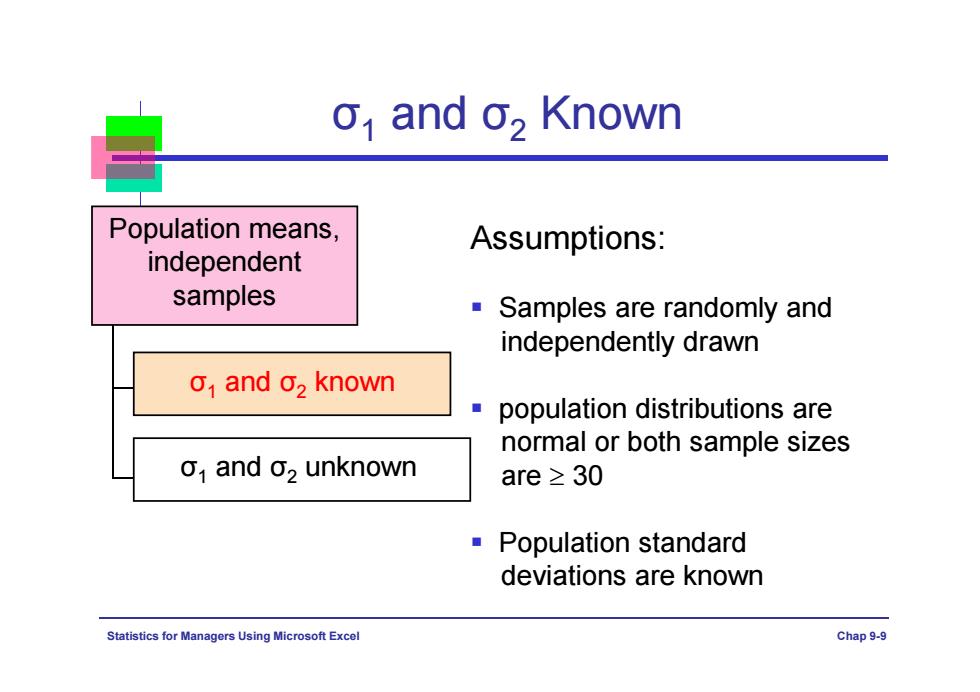
Statistics for Managers Using Microsoft Excel Chap 9-9 Population means, independent samples σ1 and σ2 known σ1 and σ2 Known Assumptions: Samples are randomly and independently drawn population distributions are normal or both sample sizes are 30 Population standard deviations are known σ1 and σ2 unknown
o,and o,Known (continued) Population means, When o,and o2 are known and independent both populations are normal or samples both sample sizes are at least 30, the test statistic is a Z-value... o and 02 known ..and the standard error of 又1-又2is o1 and o2 unknown 2 62 0x1-X2 n n2 Statistics for Managers Using Microsoft Excel Chap 9-10
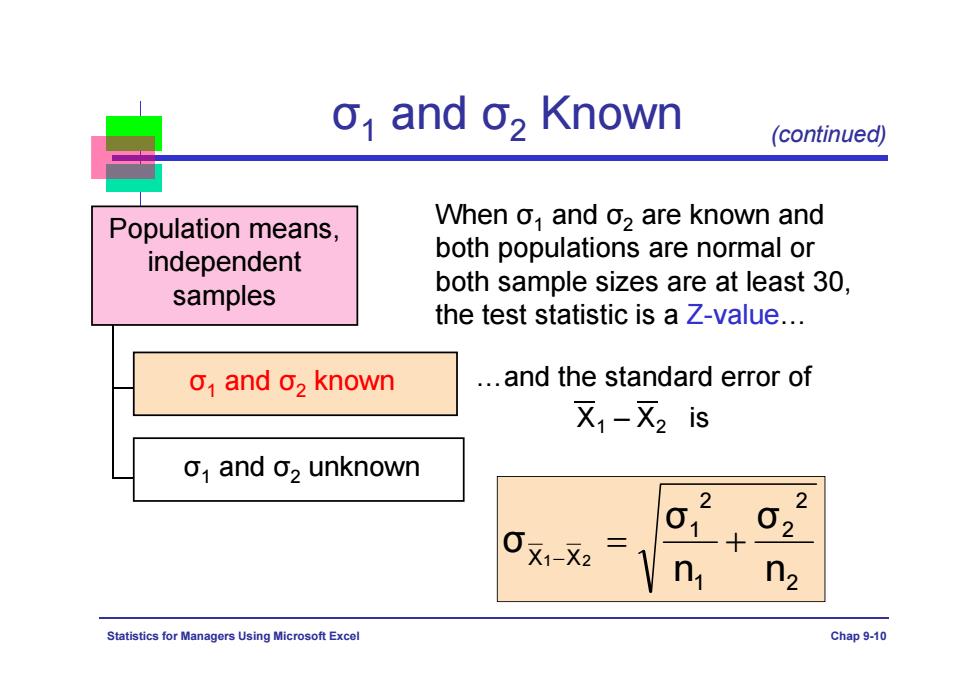
Statistics for Managers Using Microsoft Excel Chap 9-10 Population means, independent samples σ1 and σ2 known …and the standard error of X1 – X2 is When σ1 and σ2 are known and both populations are normal or both sample sizes are at least 30, the test statistic is a Z-value… 2 2 2 1 2 1 X X n σ n σ σ 1 2 σ1 (continued) and σ2 Known σ1 and σ2 unknown