Statistics for Managers using Microsoft®E Excel Chapter 3 Numerical Descriptive Measures Statistics for Ma nagers Using Microsoft Excel Chap 3-1
Statistics for Managers Using Microsoft Excel Chap 3-1 Statistics for Managers using Microsoft® Excel Chapter 3 Numerical Descriptive Measures

Learning Objectives In this chapter,you will learn: >To describe the properties of central tendency, variation and shape in numerical data To calculate descriptive summary measures for a population To construct and interpret a box-and-whisker plot >To describe the covariance and coefficient of correlation as a measure of the strength of the relationship between two numerical variables Statistics for Managers Using Microsoft Excel Chap 3-2
Statistics for Managers Using Microsoft Excel Chap 3-2 Learning Objectives In this chapter, you will learn: To describe the properties of central tendency, variation and shape in numerical data To calculate descriptive summary measures for a population To construct and interpret a box-and-whisker plot To describe the covariance and coefficient of correlation as a measure of the strength of the relationship between two numerical variables

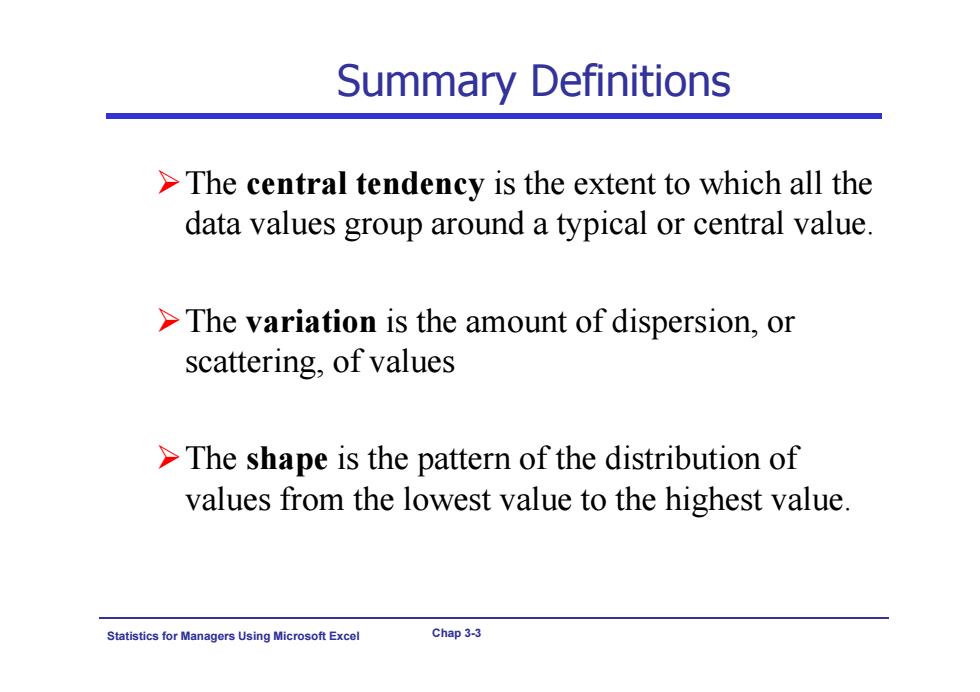
Summary Definitions >The central tendency is the extent to which all the data values group around a typical or central value. >The variation is the amount of dispersion,or scattering,of values >The shape is the pattern of the distribution of values from the lowest value to the highest value. Statistics for Ma nagers Using Microsoft Excel Chap 3-3
Statistics for Managers Using Microsoft Excel Chap 3-3 Summary Definitions The central tendency is the extent to which all the data values group around a typical or central value. The variation is the amount of dispersion, or scattering, of values The shape is the pattern of the distribution of values from the lowest value to the highest value

Chapter Topics Measures of central tendency Mean,median,mode,geometric mean ■Quartile ■Measure of variation Range,interquartile range,variance and standard deviation,coefficient of variation Shape Symmetric,skewed,using box-and-whisker plots Covariance and Coefficient of correlation Statistics for Mar nagers Using Microsoft Excel Chap 3-4
Statistics for Managers Using Microsoft Excel Chap 3-4 Chapter Topics Measures of central tendency Mean, median, mode, geometric mean Quartile Measure of variation Range, interquartile range, variance and standard deviation, coefficient of variation Shape Symmetric, skewed, using box-and-whisker plots Covariance and Coefficient of correlation

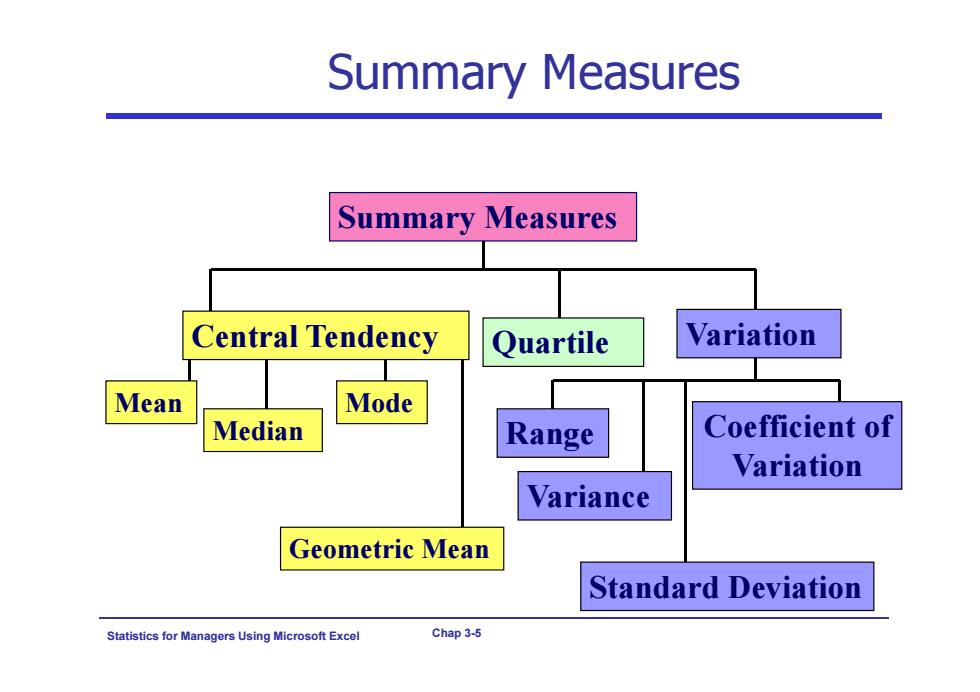
Summary Measures Summary Measures Central Tendency Quartile Variation Mean Mode Median Range Coefficient of Variation Variance Geometric Mean Standard Deviation Statistics for Ma nagers Using Microsoft Excel Chap 3-5
Statistics for Managers Using Microsoft Excel Chap 3-5 Summary Measures Central Tendency Mean Median Mode Quartile Geometric Mean Summary Measures Variation Variance Standard Deviation Coefficient of Variation Range

Central Tendency:Mean (Arithmetic Mean) Mean (arithmetic mean)of data values The most common measure of central tendency >Mean sum of values divided by the number of values Affected by extreme values (outliers) Sample mean Sample Size i= X1+X2+…+Xx The ith value Observed values Statistics for Managers Using Microsoft Excel Chap 3-6
Statistics for Managers Using Microsoft Excel Chap 3-6 Central Tendency: Mean (Arithmetic Mean) Mean (arithmetic mean) of data values Sample mean 1 12 n i i n X X X X X n n Sample Size The most common measure of central tendency Mean = sum of values divided by the number of values Affected by extreme values (outliers) The i Observed values th value

Central Tendency:Mean (Arithmetic Mean) A号w (continued) ●● 012345(789101214 Mean=5 Mean=6 1+3+5+7+925 J 5 1+3+5+7+1430 U =6 5 5 >Because its computation is based on every observation,the arithmetic mean is greatly affected by any extreme value of values.In such instances,the arithmetic mean presents a distorted representation of what the data are conveying;hence, the mean is not the best measure of central tendency to use for describing or summarizing a set of data that has extreme values. Statistics for Managers Using Microsoft Excel Chap 3-7
Statistics for Managers Using Microsoft Excel Chap 3-7 Central Tendency: Mean (Arithmetic Mean) (continued) 0 1 2 3 4 5 6 7 8 9 10 0 1 2 3 4 5 6 7 8 9 10 12 14 Mean = 5 Mean = 6 5 5 25 5 1 3 5 7 9 6 5 30 5 1 3 5 7 14 Because its computation is based on every observation, the arithmetic mean is greatly affected by any extreme value of values. In such instances, the arithmetic mean presents a distorted representation of what the data are conveying; hence, the mean is not the best measure of central tendency to use for describing or summarizing a set of data that has extreme values

Central Tendency:Locating the Median The median is the middle value in an ordered array of data It is the value for which 50%of the observations are smaller and 50%of the observations are larger Robust measure of central tendency Not affected by extreme values 891012 Median=5 Median =5 Statistics for Ma agers Using Microsoft Excel Chap 3-8
Statistics for Managers Using Microsoft Excel Chap 3-8 Central Tendency: Locating the Median The median is the middle value in an ordered array of data It is the value for which 50% of the observations are smaller and 50% of the observations are larger Robust measure of central tendency Not affected by extreme values 0 1 2 3 4 5 6 7 8 9 10 0 1 2 3 4 5 6 7 8 9 10 12 14 Median = 5 Median = 5

Central Tendency:Locating the Median >The median of an ordered set of data is located at the n+1 ranked value. 2 If the number of values is odd,the median is the middle number. If the number of values is even,the median is the average of the two middle numbers. >Note that+is NOT the value of the median, only the position of the median in the ranked data. 2.4,3,5,6,6.6,8 6+1 2 =35 Median=X3+X5+6 =5.5 2 2 Statistics Using Microsoft Excel Chap 3-9
Statistics for Managers Using Microsoft Excel Chap 3-9 Central Tendency: Locating the Median The median of an ordered set of data is located at the ranked value. If the number of values is odd, the median is the middle number. If the number of values is even, the median is the average of the two middle numbers. Note that is NOT the value of the median, only the position of the median in the ranked data. 2 n 1 2 n 1 2.4, 3, 5, 6, 6.6, 8 Median= 3.5 2 6 1 5.5 2 5 6 2 3 4 X X

Central Tendency:Mode A measure of central tendency value that occurs most often Not affected by extreme values Used for either numerical or categorical data ■There may be no mode There may be several modes ●●●●Q 012345678910 11121314 0123456 Mode=9 No Mode Statistics for Managers Using Microsoft Excel Chap 3-10
Statistics for Managers Using Microsoft Excel Chap 3-10 Central Tendency: Mode A measure of central tendency value that occurs most often Not affected by extreme values Used for either numerical or categorical data There may be no mode There may be several modes 0 1 2 3 4 5 6 7 8 9 10 11 12 13 14 Mode = 9 0 1 2 3 4 5 6 No Mode