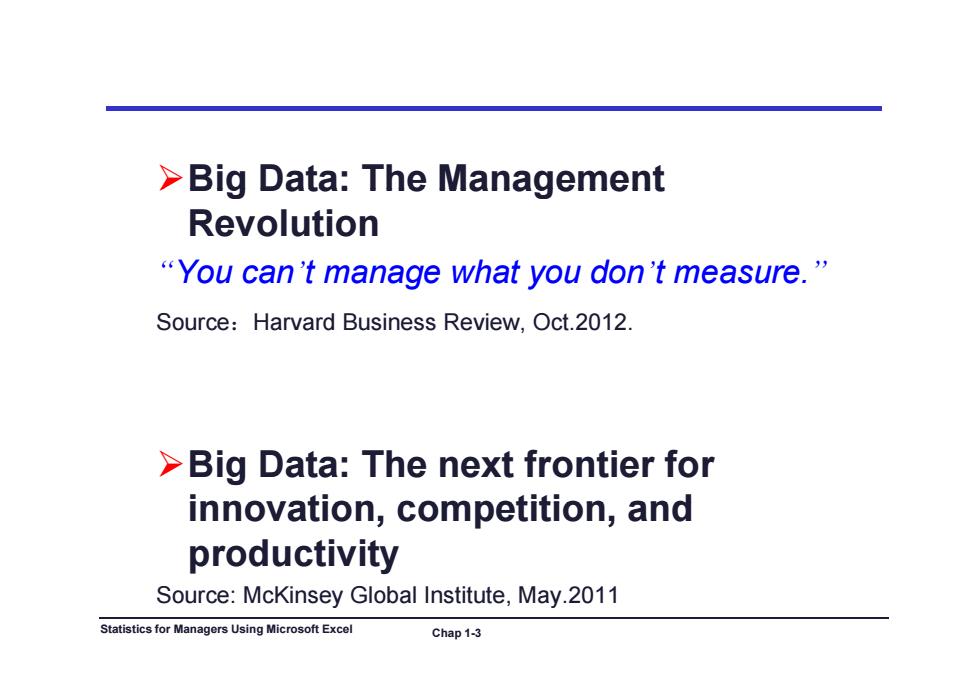
>Big Data:The Management Revolution “You can't manage what you don't measure.” Source:Harvard Business Review,Oct.2012. >Big Data:The next frontier for innovation,competition,and productivity Source:McKinsey Global Institute,May.2011 Statistics for Managers Using Microsoft Excel Chap1-3
Big Data: The Management Big Data: The Management Revolution “You can You can’t manage what you don t manage what you don’t measure t measure.” Source:Harvard Business Review, Oct.2012. Big Data: The next frontier for innovation competition and innovation, competition, and productivity Statistics for Managers Using Microsoft Excel Chap 1-3 Source: McKinsey Global Institute, May.2011
Discussion question: Why Collect Data and How? Statistics for Managers Using Microsoft Excel Chap1-4
Discussion question: Why Collect Data and How? Why Collect Data and How? Statistics for Managers Using Microsoft Excel Chap 1-4
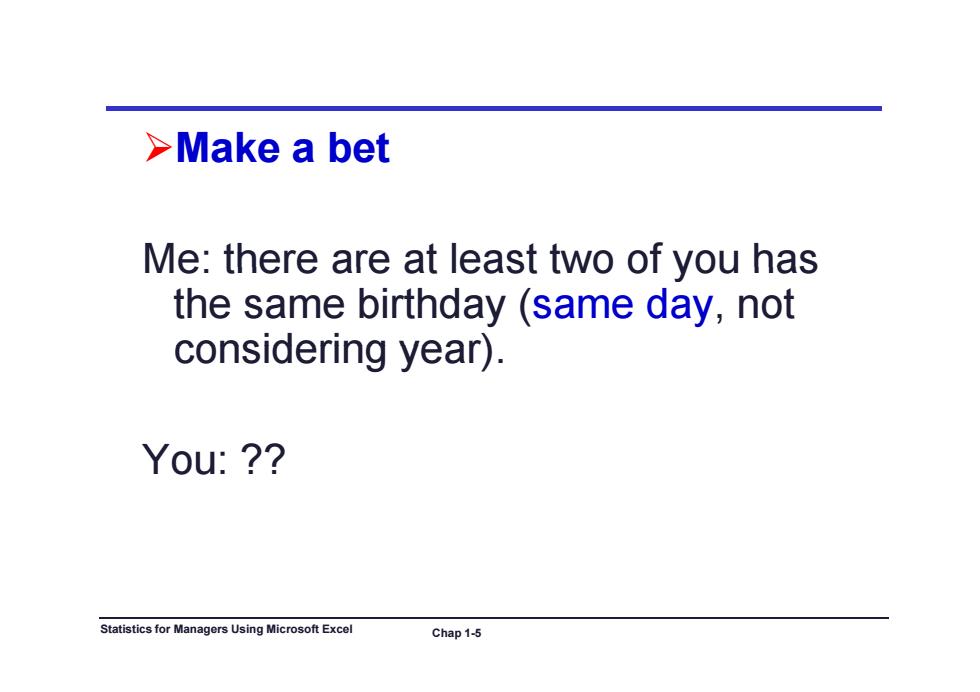
>Make a bet Me:there are at least two of you has the same birthday (same day,not considering year). You:? Statistics for Managers Using Microsoft Excel Chap 1-5
Make a bet Me: there are at least two of you has Me: there are at least two of you has the same birthday (same day, not considering year) considering year). You: ?? Statistics for Managers Using Microsoft Excel Chap 1-5
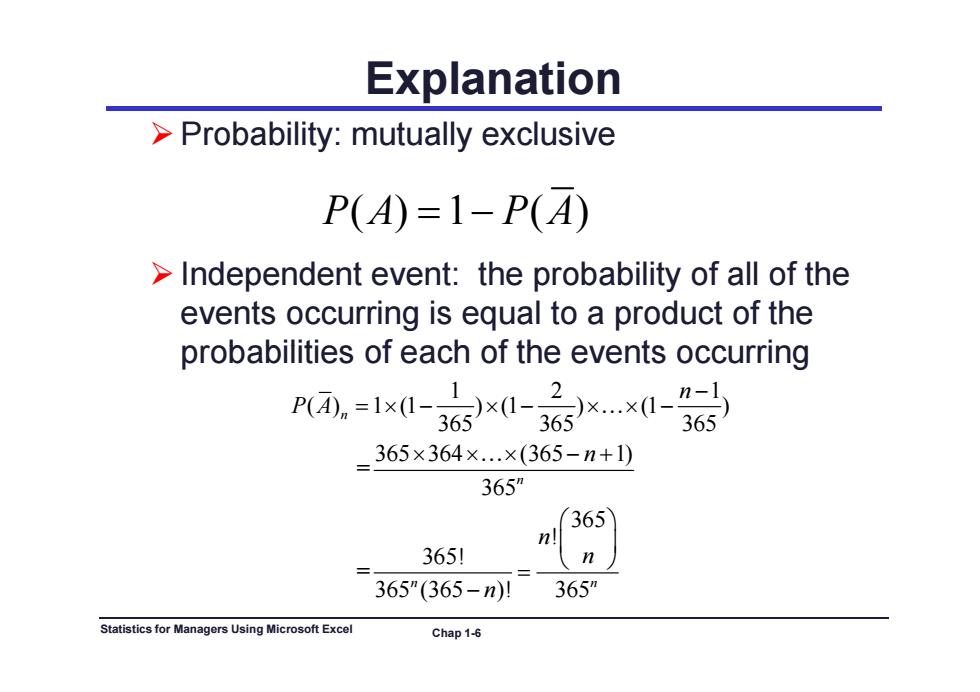
Explanation >Probability:mutually exclusive P(A)=1-P(A) >Independent event:the probability of all of the events occurring is equal to a product of the probabilities of each of the events occurring P团.=lx0-3G5xl-6xXl-36 365×364×.×(365-n+1) 365” 365 3651 n 365"(365-n)! 365m Statistics for Managers Using Microsoft Excel Chap 1-6
Explanation Probability: mutually exclusive Id d t t th b bilit f ll f th PA PA () 1 () Independent event: the probability of all of the events occurring is equal to a product of the prob biliti f h f th t i babilities of each of the events occurring 12 1 ( ) 1 (1 ) (1 ) (1 ) 365 365 365 n n P A 365 365 365 365 364 (365 1) = 365n n 365 ! 365! = ( ) n n n n Statistics for Managers Using Microsoft Excel Chap 1-6 365 (365 )! 365 n n n
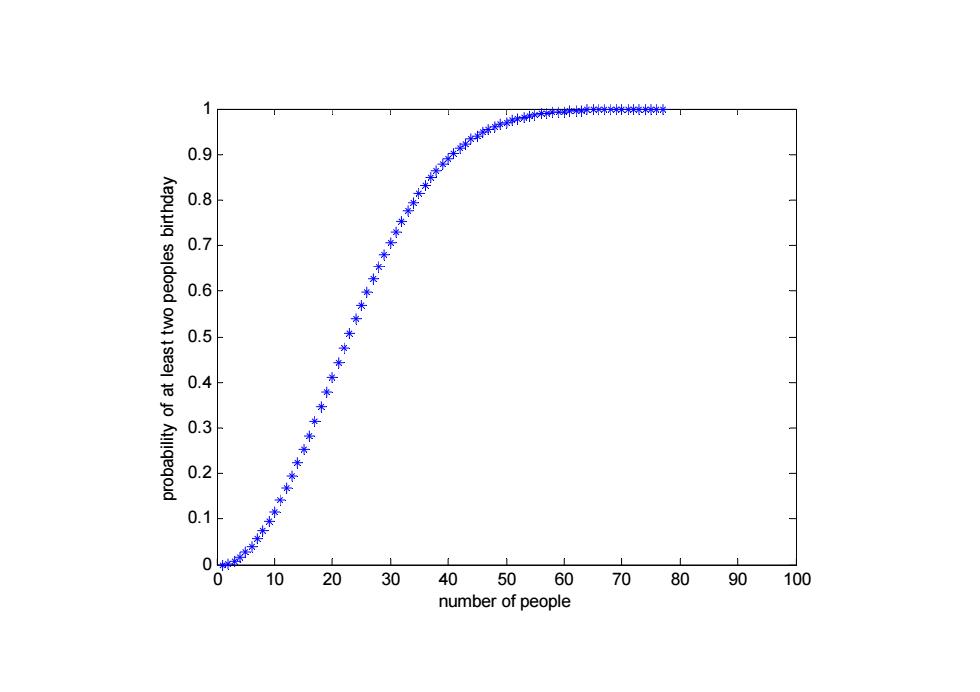
>99%probability is reached with just 57 people,and 50%probability with 23 people These conclusions are based on the assumption that each day of the year (except February 29)is equally probable for a birthday >Real-life birthday distributions are not uniform since not all dates are equally likely Statistics for Managers Using Microsoft Excel Chap 1-7
99% probability is reached with just 57 people, and 50% probability with 23 people. These conclusions are based on the assumption that each day of the year (except assumption that each day of the year (except February 29) is equally probable for a birthday R l ea -lif bi thd di t ib ti t life birthday distributions are not uniform since not all dates are equally likely Statistics for Managers Using Microsoft Excel Chap 1-7
1 米】 0.6 4 0.3 2 0.1 0 10 20 30 40 5060 70 80 90 100 number of people
1 0.9 ay 0.7 0.8 ples birthda 0.5 0.6 t two peop 0 3 0.4 y of at leas 0.2 0.3 probability 0 10 20 30 40 50 60 70 80 90 100 0 0.1 0 10 20 30 40 50 60 70 80 90 100 number of people
>3 Credits 18 weeks >Assessment Breakdown Components Percentage of final grade Class participation 10% Group work 30%(three case studies) Individual work 20% Final exam 40% Others(Please specify) Some bonus questions:5%per each.Each student can get one bonus at most. Statistics for Managers Using Microsoft Excel Chap 1-10
3 Credits 18 weeks Assessment Breakdown Assessment Breakdown Components Percentage of final grade Class participation 10% Gro p ork Group work 30% (three case st dies) 30% (three case studies) Individual work 20% Final exam 40% Others (Please specify) Some bonus questions: 5% per each. Each student can get one bonus at most. Statistics for Managers Using Microsoft Excel Chap 1-10
Course Outline >Chapter 1:Introduction and Data Collection Chapter 2:Presenting Data in Tables and Charts >Chapter 3:Numerical Descriptive Measures Chapter 4:Basic Probability and Discrete Probability Distribution >Chapter 5:The Normal Distribution and Sampling Distributions Chapter 6:Confidence Interval Estimation > Chapter 7:Fundamentals of Hypothesis Testing:One-Sample Tests >Chapter 8:Two-Sample Tests with Numerical Data >Chapter 9:Analysis of Variance(ANOVA) >Chapter 10:Tests for Two or More Samples with Categorical Data >For further study(not in our course) Chapter 11:Simple Linear Regression Chapter 12:Multiple Regression ■ Chapter 13:Time-Series Analysis ■ Chapter 14:Decision Making Chapter 15:Statistical Applications in Quality and Productivity Management Statistics for Managers Using Microsoft Excel Chap 1-11
Course Outline Chapter 1: Introduction and Data Collection Chapter 2: Presenting Data in Tables and Charts Chapter 3: Chapter 3: Numerical Descriptive Measures Numerical Descriptive Measures Chapter 4: Basic Probability and Discrete Probability Distribution Chapter 5: The Normal Distribution and Sampling Distributions Chapter 6: Chapter 6: Confidence Interval Estimation Confidence Interval Estimation Chapter 7: Fundamentals of Hypothesis Testing: One-Sample Tests Chapter 8: Two-Sample Tests with Numerical Data Ch t 9 ap ter 9: A l i f V i (ANOVA) Analysis o f Variance (ANOVA) Chapter 10: Tests for Two or More Samples with Categorical Data For further study (not in our course) Chapter 11: Simple Linear Regression Chapter 12: Multiple Regression Chapter 13: Time-Series Analysis Chapter 14: Decision Making Chapter 15: Statistical Applications in Quality and Productivity Management Statistics for Managers Using Microsoft Excel Chap 1-11
Learning Objectives In this chapter, you will learn: . Why statistics is important . How statistics is used in business . The sources of data used in business The types of data used in business The key terms The basics of Microsoft Excel Statistics for Managers Using Microsoft Excel Chap 1-12
Learning Objectives In this chapter, you will learn: Why statistics is important How statistics is used in business Th e sou ces o data used bus ess sou rces of data used in business The types of data used in business Th k t e key terms The basics of Microsoft Excel Statistics for Managers Using Microsoft Excel Chap 1-12
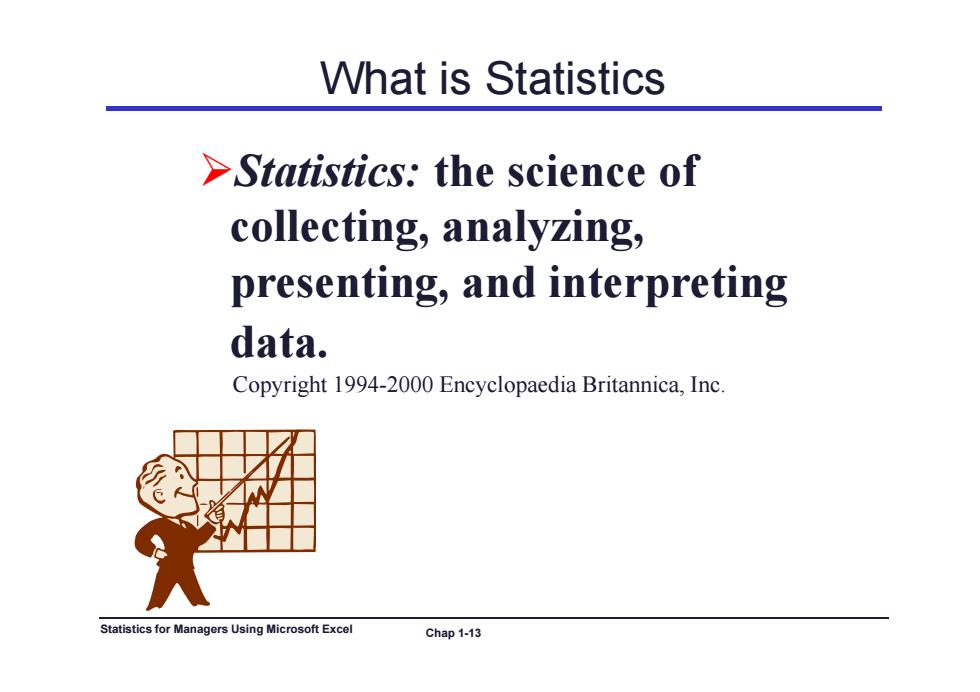
What is Statistics >Statistics:the science of collecting,analyzing, presenting,and interpreting data. Copyright 1994-2000 Encyclopaedia Britannica,Inc. Statistics for Managers Using Microsoft Excel Chap 1-13
What is Statistics Statistics: the science of collecting, analyzing, presenti di i ng, an d interpret ing data . Copyright 1994-2000 Encyclopaedia Britannica, Inc. Statistics for Managers Using Microsoft Excel Chap 1-13