Statistics for Managers Using Microsoft Excel Chapter 6 The Normal Distribution and Other Continuous Distributions Statistics for Managers Using Microsoft Excel Chap 3-1 Tongji University School of Economics Management
Statistics for Managers Using Microsoft Excel Chap 3-1 Tongji University School of Economics & Management Chapter 6 The Normal Distribution and Other Continuous Distributions Statistics for Managers Using Microsoft Excel

Learning Objectives In this chapter,you will learn: To compute probabilities from the normal distribution >To compute probabilities from the uniform distribution. To compute probabilities from the exponential distribution Statistics for Ma agers Using Microsoft Excel Chap 6-2
Statistics for Managers Using Microsoft Excel Chap 6-2 Learning Objectives In this chapter, you will learn: To compute probabilities from the normal distribution. To compute probabilities from the uniform distribution. To compute probabilities from the exponential distribution

Probability Distributions Probability Distributions Ch.5 Discrete Continuous Ch.6 Probability Probability Distributions Distributions Binomial Normal Poisson Uniform Hypergeometric Exponential Statistics for Managers Using Microsoft Excel Chap 6-3
Statistics for Managers Using Microsoft Excel Chap 6-3 Probability Distributions Continuous Probability Distributions Binomial Hypergeometric Poisson Probability Distributions Discrete Probability Distributions Normal Uniform Exponential Ch. 5 Ch. 6

Continuous Probability Distributions >A continuous random variable is a variable that can assume any value on a continuum (can assume an uncountable number of values) ●thickness of an item time required to complete a task o temperature of a solution ●height These can potentially take on any value,depending only on the ability to measure precisely and accurately. Statistics for agers Using Microsoft Excel Chap 6-4
Statistics for Managers Using Microsoft Excel Chap 6-4 Continuous Probability Distributions A continuous random variable is a variable that can assume any value on a continuum (can assume an uncountable number of values) thickness of an item time required to complete a task temperature of a solution height These can potentially take on any value, depending only on the ability to measure precisely and accurately

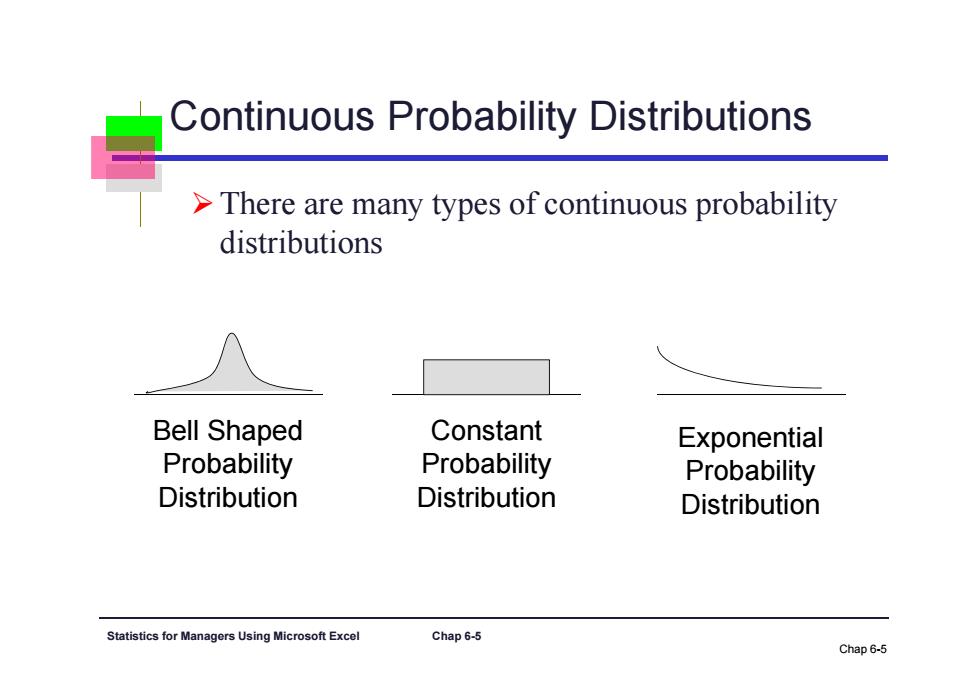
Continuous Probability Distributions >There are many types of continuous probability distributions Bell Shaped Constant Exponential Probability Probability Probability Distribution Distribution Distribution Statistics for Managers Using Microsoft Excel Chap6-5 Chap6-5
Statistics for Managers Using Microsoft Excel Chap 6-5 Continuous Probability Distributions There are many types of continuous probability distributions Chap 6-5 Bell Shaped Probability Distribution Constant Probability Distribution Exponential Probability Distribution

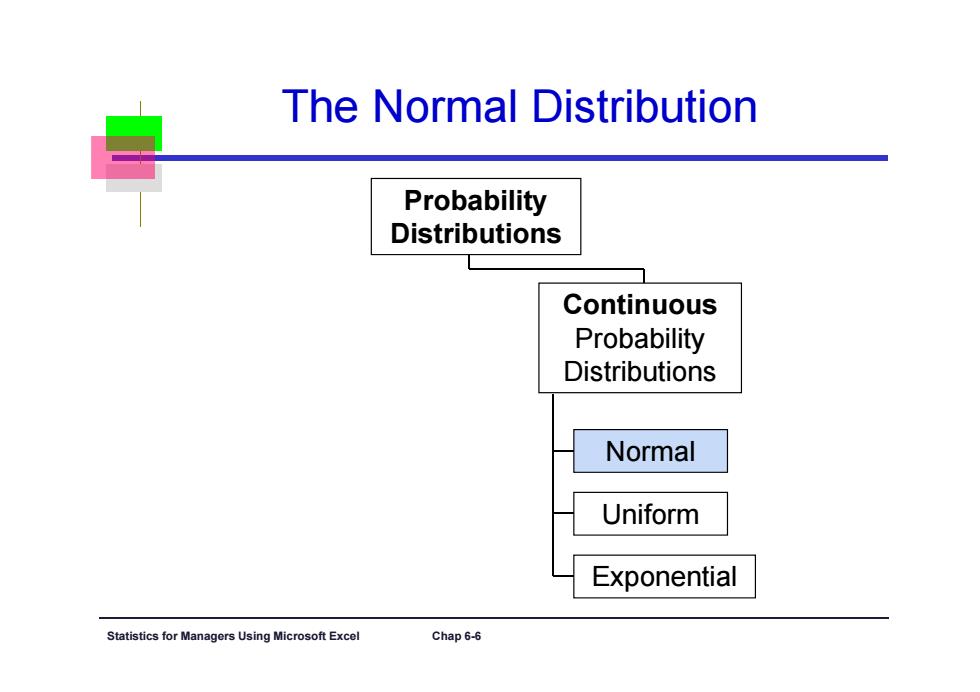
The Normal Distribution Probability Distributions Continuous Probability Distributions Normal Uniform Exponential Statistics for Managers Using Microsoft Exce Chap 6-6
Statistics for Managers Using Microsoft Excel Chap 6-6 The Normal Distribution Probability Distributions Normal Uniform Exponential Continuous Probability Distributions

The Normal Distribution Properties Bell Shaped ☒ >Symmetrical > Mean,Median and Mode are all identical Location is determined by the mean,u Spread is determined by the standard deviation,o Mean Median The random variable X has an =Mode infinite theoretical range: +0t0-o(i.e,-o<X<+o) Statistics for Managers Using Microsoft Excel Chap 6-7
Statistics for Managers Using Microsoft Excel Chap 6-7 The Normal Distribution Properties Mean = Median = Mode f(X) μ σ ‘Bell Shaped’ Symmetrical Mean, Median and Mode are all identical Location is determined by the mean, μ Spread is determined by the standard deviation, σ The random variable X has an infinite theoretical range: + to (i.e., <X< + )

Many Normal Distributions By varying the parameters u and o,we obtain different normal distributions Statistics for Ma Using Microsoft Excel Chap 6-8
Statistics for Managers Using Microsoft Excel Chap 6-8 By varying the parameters μ and σ, we obtain different normal distributions Many Normal Distributions

The Normal Distribution Shape f(X) Changingμshifts the distribution left or right. Changing o increases or decreases the spread X Statistics for Managers Using Microsoft Excel Chap 6-9
Statistics for Managers Using Microsoft Excel Chap 6-9 The Normal Distribution Shape Changing μ shifts the distribution left or right. Changing σ increases or decreases the spread. X f(X) μ σ

Probability Density Function >A density curve (or probability density function,PDF)is a graph of a continuous probability distribution.It must satisfy the following properties: The total area under the curve must equal 1 Every point on the curve must have a vertical height that is 0 or greater Statistics for Managers Using Microsoft Excel Chap 6-10
Statistics for Managers Using Microsoft Excel Chap 6-10 Probability Density Function A density curve (or probability density function, PDF) is a graph of a continuous probability distribution. It must satisfy the following properties: The total area under the curve must equal 1 Every point on the curve must have a vertical height that is 0 or greater