Point Estimate Mini Case:German Tank Problem >Play Game Statistics for Managers Using Microsoft Excel Chap 7-1
Statistics for Managers Using Microsoft Excel Chap 7-1 Point Estimate Mini Case: German Tank Problem Play Game

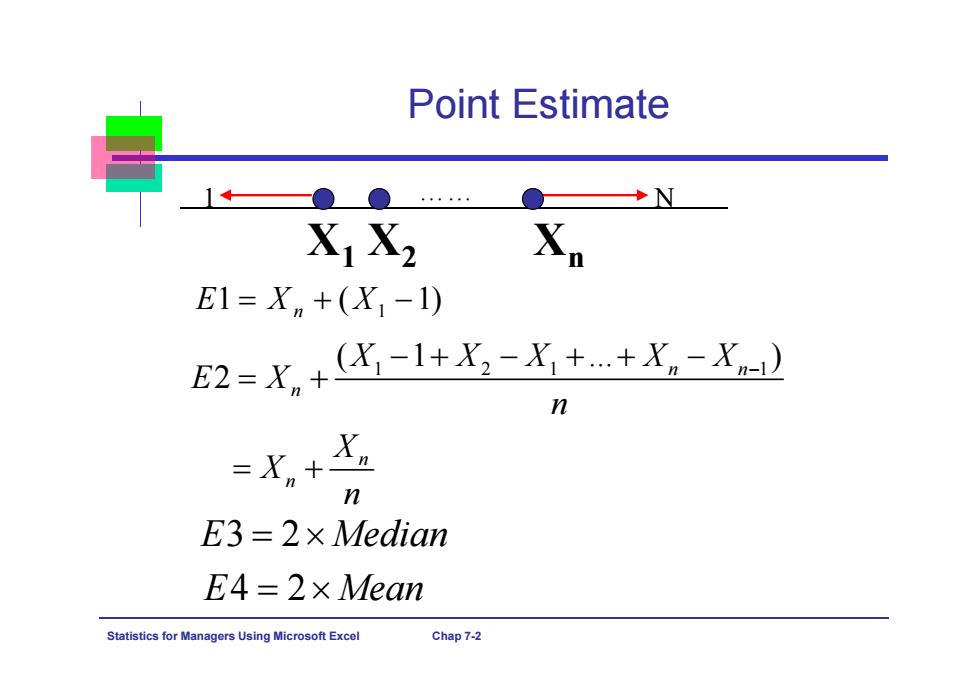
Point Estimate 1←●● ◆N XiX2 E1=Xn+(X1-1) E2=X,+X-l+X,-X++X。-X n n E3=2x Median E4=2×Mean Statistics for Managers Using Microsoft Excel Chap 7-2
Statistics for Managers Using Microsoft Excel Chap 7-2 Point Estimate X 1 X 2 X n 1 N …… 1 1 ( 1) EX X n 1 21 1 ( 1 ... ) 2 n n n n n X XX XX E X n X X n E3 2 Median E4 2 Mean

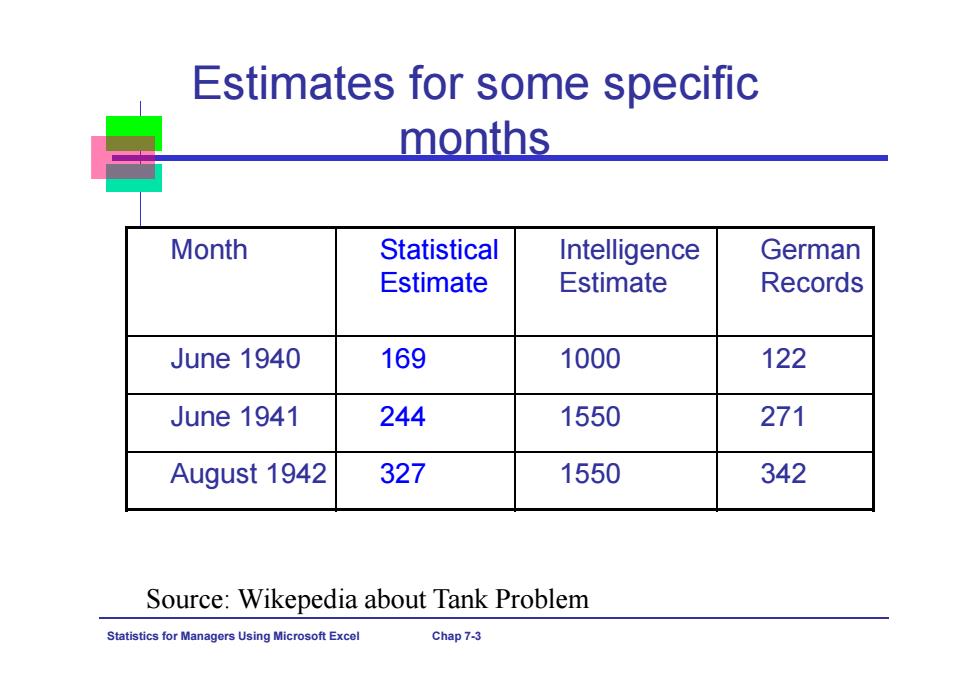
Estimates for some specific months Month Statistical Intelligence German Estimate Estimate Records June 1940 169 1000 122 June 1941 244 1550 271 August 1942 327 1550 342 Source:Wikepedia about Tank Problem Statistics for Managers Using Microsoft Excel Chap 7-3
Statistics for Managers Using Microsoft Excel Chap 7-3 Estimates for some specific months Month Statistical Estimate Intelligence Estimate German Records June 1940 169 1000 122 June 1941 244 1550 271 August 1942 327 1550 342 Source: Wikepedia about Tank Problem

A Mini Case Discussion >We are the maker of the cereal box of 16 ounce.Consumer reports has just published an article that shows that we frequently have less than 15 ounces of cereal in a box. >What should we do? Statistics for Managers Using Microsoft Excel Chap 7-4
Statistics for Managers Using Microsoft Excel Chap 7-4 We are the maker of the cereal box of 16 ounce. Consumer reports has just published an article that shows that we frequently have less than 15 ounces of cereal in a box. What should we do? A Mini Case Discussion

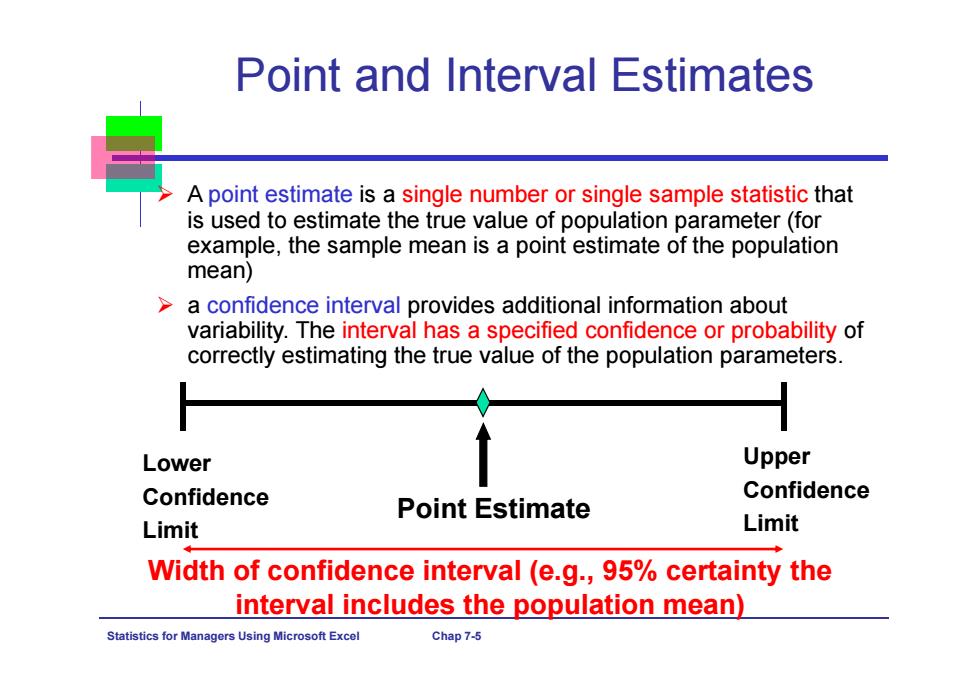
Point and Interval Estimates A point estimate is a single number or single sample statistic that is used to estimate the true value of population parameter(for example,the sample mean is a point estimate of the population mean) a confidence interval provides additional information about variability.The interval has a specified confidence or probability of correctly estimating the true value of the population parameters. Lower Upper Confidence Confidence Point Estimate Limit Limit Width of confidence interval (e.g.,95%certainty the interval includes the population mean) Statistics for Ma agers Using Microsoft Excel Chap 7-5
Statistics for Managers Using Microsoft Excel Chap 7-5 Point and Interval Estimates A point estimate is a single number or single sample statistic that is used to estimate the true value of population parameter (for example, the sample mean is a point estimate of the population mean) a confidence interval provides additional information about variability. The interval has a specified confidence or probability of correctly estimating the true value of the population parameters. Point Estimate Lower Confidence Limit Upper Confidence Limit Width of confidence interval (e.g., 95% certainty the interval includes the population mean)

Point Estimates We can estimate a with a Sample Population Parameter... Statistic (a Point Estimate) Mean Proportion p Ps Statistics for Managers Using Microsoft Excel Chap7-6
Statistics for Managers Using Microsoft Excel Chap 7-6 We can estimate a Population Parameter … Point Estimates with a Sample Statistic (a Point Estimate) Mean Proportion p s p μ X

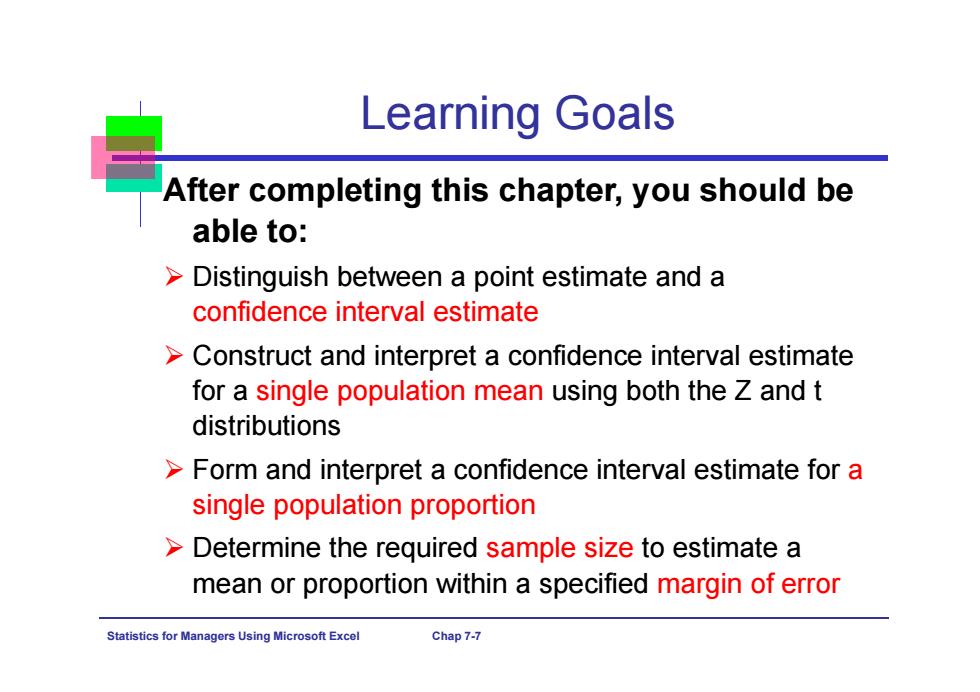
Learning Goals After completing this chapter,you should be able to: >Distinguish between a point estimate and a confidence interval estimate >Construct and interpret a confidence interval estimate for a single population mean using both the Z and t distributions >Form and interpret a confidence interval estimate for a single population proportion >Determine the required sample size to estimate a mean or proportion within a specified margin of error Statistics for Ma agers Using Microsoft Excel Chap7-7
Statistics for Managers Using Microsoft Excel Chap 7-7 Learning Goals After completing this chapter, you should be able to: Distinguish between a point estimate and a confidence interval estimate Construct and interpret a confidence interval estimate for a single population mean using both the Z and t distributions Form and interpret a confidence interval estimate for a single population proportion Determine the required sample size to estimate a mean or proportion within a specified margin of error

Confidence Interval Estimate >An interval gives a range of values: .Takes into consideration variation in sample statistics from sample to sample Based on observation from 1 sample Gives information about closeness to unknown population parameters Stated in terms of level of confidence -Can never be 100%confident Statistics for Mar agers Using Microsoft Excel Chap7-8
Statistics for Managers Using Microsoft Excel Chap 7-8 Confidence Interval Estimate An interval gives a range of values: Takes into consideration variation in sample statistics from sample to sample Based on observation from 1 sample Gives information about closeness to unknown population parameters Stated in terms of level of confidence Can never be 100% confident

Estimation Process Random Sample I am 95% confident that Population μis between Mean 40&60. (meanμ,is X=50 unknown) A 95%confidence interval estimate is Sample interpreted as follows:if all possible samples of the same size n are taken and their sample means are computed, 95%of the intervals include the true population mean somewhere within the interval around their sample means,and only 5%of them do not. Statistics for Ma nagers Using Microsoft Excel Chap 7-9
Statistics for Managers Using Microsoft Excel Chap 7-9 Estimation Process (mean, μ, is unknown) Population Random Sample Mean X = 50 Sample I am 95% confident that μ is between 40 & 60. A 95% confidence interval estimate is interpreted as follows: if all possible samples of the same size n are taken and their sample means are computed, 95% of the intervals include the true population mean somewhere within the interval around their sample means, and only 5% of them do not

General Formula >The general formula for all confidence intervals is: Point Estimate+(Critical Value)(Standard Error) Margin of error (e) Margin of error(e)=(UCL-LCL)/2 Point Estimate =(UCL+LCL)/2 Confidence Interval=2*Margin of error Statistics for Ma Using Microsoft Excel Chap 7-10
Statistics for Managers Using Microsoft Excel Chap 7-10 General Formula The general formula for all confidence intervals is: Point Estimate ± (Critical Value)(Standard Error) Margin of error (e) Margin of error (e)=(UCL-LCL)/2 Point Estimate = (UCL+LCL)/2 Confidence Interval=2*Margin of error