Biostatistics for Animal Science Uae长ra and Universi o Misour-Columbi USA CABI Publishing
Biostatistics for Animal Science Miroslav Kaps University of Zagreb, Croatia and William R. Lamberson University of Missouri-Columbia, USA CABI Publishing
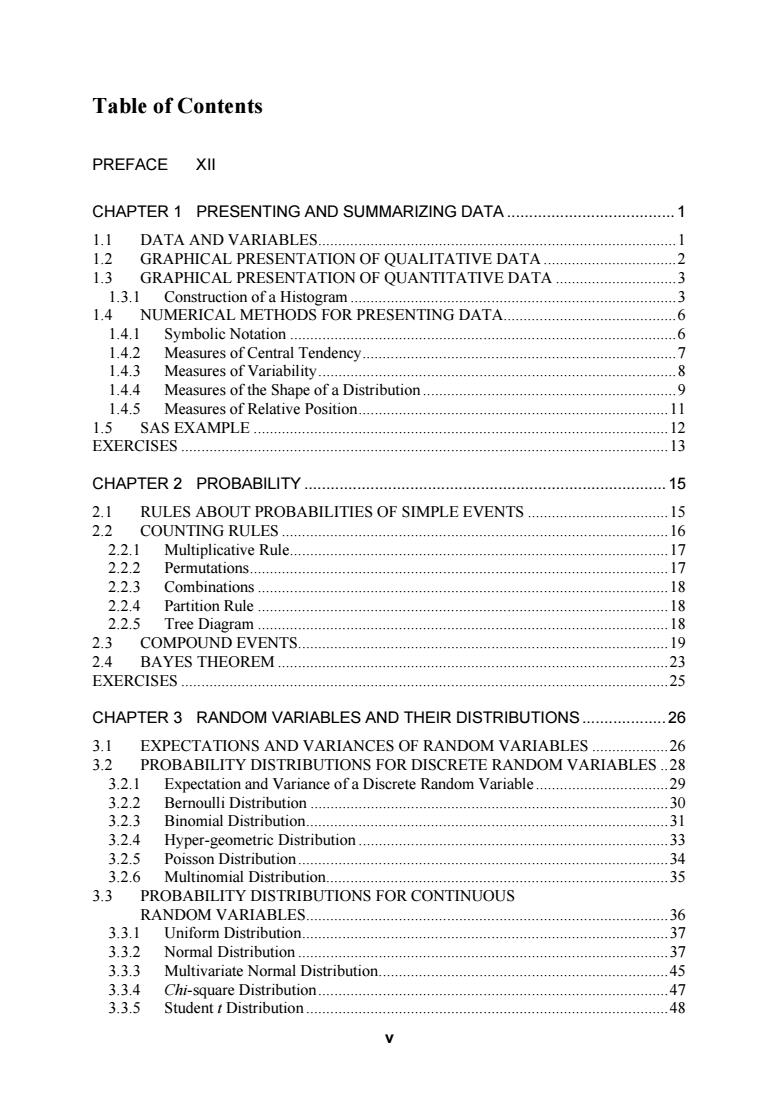
Table of Contents PREFACE CHAPTER 1 PRESENTING AND SUMMARIZING DATA .1 DATA AND VARIABLES TION OF QUALITATIVE DATA GRAPHICAL PRESENTA ION OF QUANTITATIVE DATA 3 ofa Hist 1.4 NUMERICAL METHODS FOR PRESENTING DATA. 14 143 144 Measures of the Shape of a Distribution. 1.4.5 Measures of Relative Position. EXERCISES XAMPLE CHAPTER 2 PROBABILITY. 15 RULES ABOUT PROBABILITIES OF SIMPLE EVENTS 17 2.2.3 Combinations 18 324 Partition Rule COMPOUND EVENTS 24 BAYES THEOREM. EXERCISES. 25 CHAPTER 3 RANDOM VARIABLES AND THEIR DISTRIBUTIONS 26 31 PROBABILITY DISTRIBUTIONS FOR DISCRETE RANDOM VARIABLES EXPECTATIONS AND VARIANCES OF RANDOM VARIABLES 32 3.2.1 Expectation and Variance of a Discrete Random Variable ut10n. 03 324 3.2.5 Poisson Distribution .2.6 Multinomial Distribution. 35 33 FOR CONTINUOUS 3.3.1 67 332 Normal Distribution 37 3.3.3 Multivariate Normal Distribution. eaDistrbution 灯锅
v Table of Contents PREFACE XII CHAPTER 1 PRESENTING AND SUMMARIZING DATA .1 1.1 DATA AND VARIABLES.1 1.2 GRAPHICAL PRESENTATION OF QUALITATIVE DATA .2 1.3 GRAPHICAL PRESENTATION OF QUANTITATIVE DATA .3 1.3.1 Construction of a Histogram .3 1.4 NUMERICAL METHODS FOR PRESENTING DATA.6 1.4.1 Symbolic Notation .6 1.4.2 Measures of Central Tendency.7 1.4.3 Measures of Variability.8 1.4.4 Measures of the Shape of a Distribution .9 1.4.5 Measures of Relative Position.11 1.5 SAS EXAMPLE .12 EXERCISES .13 CHAPTER 2 PROBABILITY .15 2.1 RULES ABOUT PROBABILITIES OF SIMPLE EVENTS .15 2.2 COUNTING RULES .16 2.2.1 Multiplicative Rule.17 2.2.2 Permutations.17 2.2.3 Combinations .18 2.2.4 Partition Rule .18 2.2.5 Tree Diagram .18 2.3 COMPOUND EVENTS.19 2.4 BAYES THEOREM .23 EXERCISES .25 CHAPTER 3 RANDOM VARIABLES AND THEIR DISTRIBUTIONS .26 3.1 EXPECTATIONS AND VARIANCES OF RANDOM VARIABLES .26 3.2 PROBABILITY DISTRIBUTIONS FOR DISCRETE RANDOM VARIABLES .28 3.2.1 Expectation and Variance of a Discrete Random Variable .29 3.2.2 Bernoulli Distribution .30 3.2.3 Binomial Distribution.31 3.2.4 Hyper-geometric Distribution .33 3.2.5 Poisson Distribution.34 3.2.6 Multinomial Distribution.35 3.3 PROBABILITY DISTRIBUTIONS FOR CONTINUOUS RANDOM VARIABLES.36 3.3.1 Uniform Distribution.37 3.3.2 Normal Distribution .37 3.3.3 Multivariate Normal Distribution.45 3.3.4 Chi-square Distribution.47 3.3.5 Student t Distribution .48

vi Biostatistics for Animal Science CHAPTER 4 POPULATION AND SAMPLE 53 4.1 FUNCTIONS OF RANDOM VARIABLES AND SAMPLING DISTRIBUTIO 4.1 entra tions Other than Normal DEGREES OF FREEDOM. 55 CHAPTER 5 ESTIMATION OF PARAMETERS 56 51 POINT ESTIMATION 5.3 INTERVA TIM HOOD ESTIMATION F PARAMETERS OF A NORMAL POPULATION m Like ood E ea 54.3 terval nterval Es mation of th /ariance. 6 EXERCISE 64 CHAPTER 6 HYPOTHESIS TESTING 65 6.1 HYPOTHESIS TEST OF A POPULATION MEAN 6 69 sided 6.13 othesis Test Can Be One 71 6 TWO POPULATION MEANS 17 621 73 62 sand Equal Var nces 65 d Unequal Variances 75 Depender 75 63S 76 626 ofTwo Population Means 70 63 HYPOTHESIS TEST OF A POPULATION PROPORTION. 81 HYPOTHESIS TEST OF THE DIFFERENCE BETWEEN PROPORTIONS EROM TWO POPIL ATIONS 82 6.5 CHI-SQUARE TEST OF THE DIFFERENCE BETWEEN OBSERVED AND EXpecTed FREOUENCIES 84 6.5.1 SAS Example for Testing the Difference between Observed and Expected 85 6.6 HYPOTHESIS TEST OF DIFFERENCES AMONG PROPORTIONS FROM SEVERAL POPULATIONS .86 6.6.1 SAS Example for Testing Differences among Proportions from Several Populations 88 6.7 HYPOTHESIS TEST OF POPULATION VARIANCE. 90 6.8 HYPOTHESIS TEST OF THE DIFFERENCE OF TWO POPULATION VARIANCES. 6.9 HYPOTHESIS TESTS USING CONFIDENCE INTERVALS 91
vi Biostatistics for Animal Science 3.3.6 F Distribution.50 EXERCISES .51 CHAPTER 4 POPULATION AND SAMPLE .53 4.1 FUNCTIONS OF RANDOM VARIABLES AND SAMPLING DISTRIBUTIONS .53 4.1.1 Central Limit Theorem.54 4.1.2 Statistics with Distributions Other than Normal .54 4.2 DEGREES OF FREEDOM.55 CHAPTER 5 ESTIMATION OF PARAMETERS.56 5.1 POINT ESTIMATION .56 5.2 MAXIMUM LIKELIHOOD ESTIMATION .57 5.3 INTERVAL ESTIMATION .58 5.4 ESTIMATION OF PARAMETERS OF A NORMAL POPULATION.60 5.4.1 Maximum Likelihood Estimation .60 5.4.2 Interval Estimation of the Mean.61 5.4.3 Interval Estimation of the Variance.62 EXERCISES .64 CHAPTER 6 HYPOTHESIS TESTING.65 6.1 HYPOTHESIS TEST OF A POPULATION MEAN.66 6.1.1 P value.69 6.1.2 A Hypothesis Test Can Be One- or Two-sided.70 6.1.3 Hypothesis Test of a Population Mean for a Small Sample.71 6.2 HYPOTHESIS TEST OF THE DIFFERENCE BETWEEN TWO POPULATION MEANS.72 6.2.1 Large Samples.72 6.2.2 Small Samples and Equal Variances.74 6.2.3 Small Samples and Unequal Variances.75 6.2.4 Dependent Samples.75 6.2.5 Nonparametric Test.76 6.2.6 SAS Examples for Hypotheses Tests of Two Population Means.79 6.3 HYPOTHESIS TEST OF A POPULATION PROPORTION.81 6.4 HYPOTHESIS TEST OF THE DIFFERENCE BETWEEN PROPORTIONS FROM TWO POPULATIONS.82 6.5 CHI-SQUARE TEST OF THE DIFFERENCE BETWEEN OBSERVED AND EXPECTED FREQUENCIES .84 6.5.1 SAS Example for Testing the Difference between Observed and Expected Frequencies .85 6.6 HYPOTHESIS TEST OF DIFFERENCES AMONG PROPORTIONS FROM SEVERAL POPULATIONS .86 6.6.1 SAS Example for Testing Differences among Proportions from Several Populations.88 6.7 HYPOTHESIS TEST OF POPULATION VARIANCE.90 6.8 HYPOTHESIS TEST OF THE DIFFERENCE OF TWO POPULATION VARIANCES.90 6.9 HYPOTHESIS TESTS USING CONFIDENCE INTERVALS.91
Contents vii 6.10 STATISTICAL AND PRACTICAL SIGNIFICANCE. 92 6.11 TYPES OF ERRORS IN INFERENCES AND POWER OF TEST 2 6.11.1 SAS Examples for the Power of Test. 6.12 SAMPLE SIZE 103 6.12.1 SAS Examples for Sample Size. 104 EXERCISES. 107 CHAPTER 7 SIMPLE LINEAR REGRESSION 109 7.1 THE SIMPLE REGRESSION MODEL 109 7.2 ESTIMATION OF THE REGRESSION PARAMETERS-LEAST SQUARES ESTIMATION. 113 73 MAXIMUM LIKELIHOOD ESTIMATION .116 7.4 RESIDUALS AND THEIR PROPERTIES. .117 EXPECTATIONS AND VARIANCES OF THE PARAMETER ESTIMATORS. .119 7.6 STUDENT TTEST IN TESTING HYPOTHESES ABOUT THE PARAMETERS. 120 CONFIDENCE INTERVALS OF THE PARAMETERS. 121 MEAN AND PREDICTION CONFIDENCE INTERVALS OF THE RESPONSE VARIABLE .122 7.9 PARTITIONING TOTAL VARIABILITY. 124 7.9.1 Relationships among Sums of Squares. 126 7.9.2 Theoretical Distribution of Sum of Squares. 127 7.10 TEST OF HYPOTHESES-FTEST. 12 7.11 LIKELIHOOD RATIO TEST. 130 7.12 COEFFICIENT OF DETERMINATION. 132 7.12.1 Shortcut Calculation of Sums of Squares and the Coefficient of Determination. 133 7.13 MATRIX APPROACH TO SIMPLE LINEAR REGRESSION. 134 7.13.1 The Simple Regression Model. 134 7.132 Estimation of Parameters. 7.13.3 Maximum Likelihood Estimation 7.14 SAS EXAMPLE FOR SIMPLE LINEAR REGRESSION 139 7.15 PW上ROF IESIS 7.15.1 SAS Examples for Calculating the Power of Test. 142 EXERCISES. 144 CHAPTER 8 CORRELATION. 146 81 ESTIMATION OF THE COEFFICIENT OF CORRELATION AND TESTS OF HYPOIHES 147 8.2 CAL RELATIONSHIP BETWEEN THE SAMPLE COEFFICIENT OF CORRELATION AND THE COEFFICIENT OF DETERMINATION. 149 8.2.1 SAS for Correlation. 151 83.1 SAS Example for Rank Correlation EXERCISES. 153
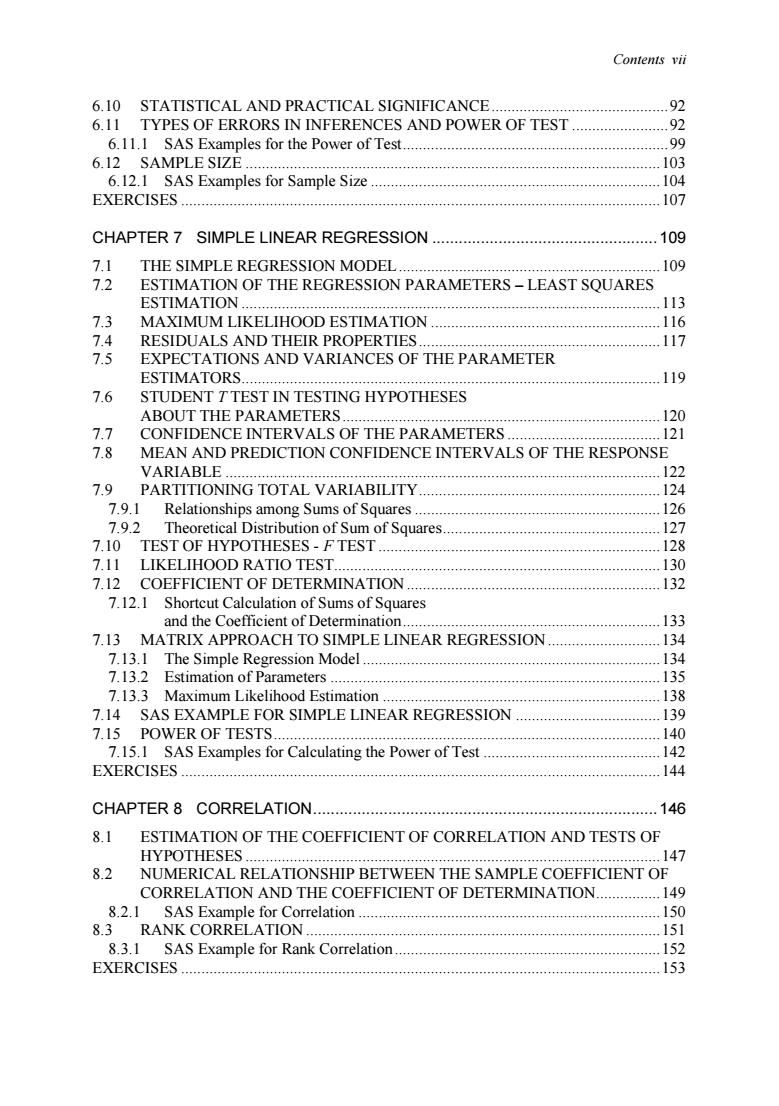
Contents vii 6.10 STATISTICAL AND PRACTICAL SIGNIFICANCE.92 6.11 TYPES OF ERRORS IN INFERENCES AND POWER OF TEST .92 6.11.1 SAS Examples for the Power of Test.99 6.12 SAMPLE SIZE .103 6.12.1 SAS Examples for Sample Size .104 EXERCISES .107 CHAPTER 7 SIMPLE LINEAR REGRESSION .109 7.1 THE SIMPLE REGRESSION MODEL.109 7.2 ESTIMATION OF THE REGRESSION PARAMETERS – LEAST SQUARES ESTIMATION .113 7.3 MAXIMUM LIKELIHOOD ESTIMATION .116 7.4 RESIDUALS AND THEIR PROPERTIES.117 7.5 EXPECTATIONS AND VARIANCES OF THE PARAMETER ESTIMATORS.119 7.6 STUDENT T TEST IN TESTING HYPOTHESES ABOUT THE PARAMETERS.120 7.7 CONFIDENCE INTERVALS OF THE PARAMETERS .121 7.8 MEAN AND PREDICTION CONFIDENCE INTERVALS OF THE RESPONSE VARIABLE .122 7.9 PARTITIONING TOTAL VARIABILITY.124 7.9.1 Relationships among Sums of Squares .126 7.9.2 Theoretical Distribution of Sum of Squares.127 7.10 TEST OF HYPOTHESES - F TEST .128 7.11 LIKELIHOOD RATIO TEST.130 7.12 COEFFICIENT OF DETERMINATION .132 7.12.1 Shortcut Calculation of Sums of Squares and the Coefficient of Determination.133 7.13 MATRIX APPROACH TO SIMPLE LINEAR REGRESSION .134 7.13.1 The Simple Regression Model .134 7.13.2 Estimation of Parameters .135 7.13.3 Maximum Likelihood Estimation .138 7.14 SAS EXAMPLE FOR SIMPLE LINEAR REGRESSION .139 7.15 POWER OF TESTS.140 7.15.1 SAS Examples for Calculating the Power of Test .142 EXERCISES .144 CHAPTER 8 CORRELATION.146 8.1 ESTIMATION OF THE COEFFICIENT OF CORRELATION AND TESTS OF HYPOTHESES .147 8.2 NUMERICAL RELATIONSHIP BETWEEN THE SAMPLE COEFFICIENT OF CORRELATION AND THE COEFFICIENT OF DETERMINATION.149 8.2.1 SAS Example for Correlation .150 8.3 RANK CORRELATION .151 8.3.1 SAS Example for Rank Correlation .152 EXERCISES .153
viii Biostatistics for Animal Science CHAPTER 9 MULTIPLE LINEAR REGRESSION 154 9.1 TWO INDEPENDENT VARIABLES 15 9 913 dent r test 160 9 LIK SAS EXAMPLE FOR MULTI LE RE RE 68 9 POWER OF MULTIPL ESSION 5.1 96 Power PROBLEMS WIH REGRESSION 061 nalys 173 9.6.2 963 Mu 17 9.6.4 Detectin g Problems with Regression 17 97 CHOOSING THE BEST MODEL 181 71 SAS E xample for r Model Selection 183 CHAPTER 10 CURVILINEAR REGRESSION 185 10.1 POLYNOMIAL REGRESSION 1011 SAS Ex ale for ou adratic Regression 102 NonLInEAR REGRESSION 100 1021 SASEx ple for Nonlinear Regression 192 10.3 SEGMENTED REGRESSION 194 10.3.1 SAS Examples for Segme nted Regression. 10Q 10311 gress with Two Simple Regressions. 198 10312 le for S ented re on with platea 200 CHAPTER 11 ONE-WAY ANALYSIS OF VARIANCE 204 Il THE FIXED EFFECTS ONE-WAY MODEL 206 11 11 Partitioning Total variability 20R 11.1.2 Hypothesis Test-FTest )10 1112 214 11.1.4 Maximum Likelihood Estimation 21d 11.1.5 Likelihood Ratio Test. 215 11 1 6 Multinle Comparisons among groun Means 217 11161 Least Significance Difference (LSD). 217 11.1.6.2 Tukey Test. 218 11.1.63 Con asts 220 11.1.64 nal contrasts 221 11165 Scheffe Test. 22 11.1.7 Test of Homogeneity of Variance. 225 11.1.8 SAS Example for the Fixed Effects One-way Model. 226 11.1.9 Power of the Fixed Effects One-way Model. 228 11.1.9.1 SAS Example for Calculating Power. 230 11.2 THE RANDOM EFFECTS ONE-WAY MODEL 231 11.2.1 Hypothesis Test. 233
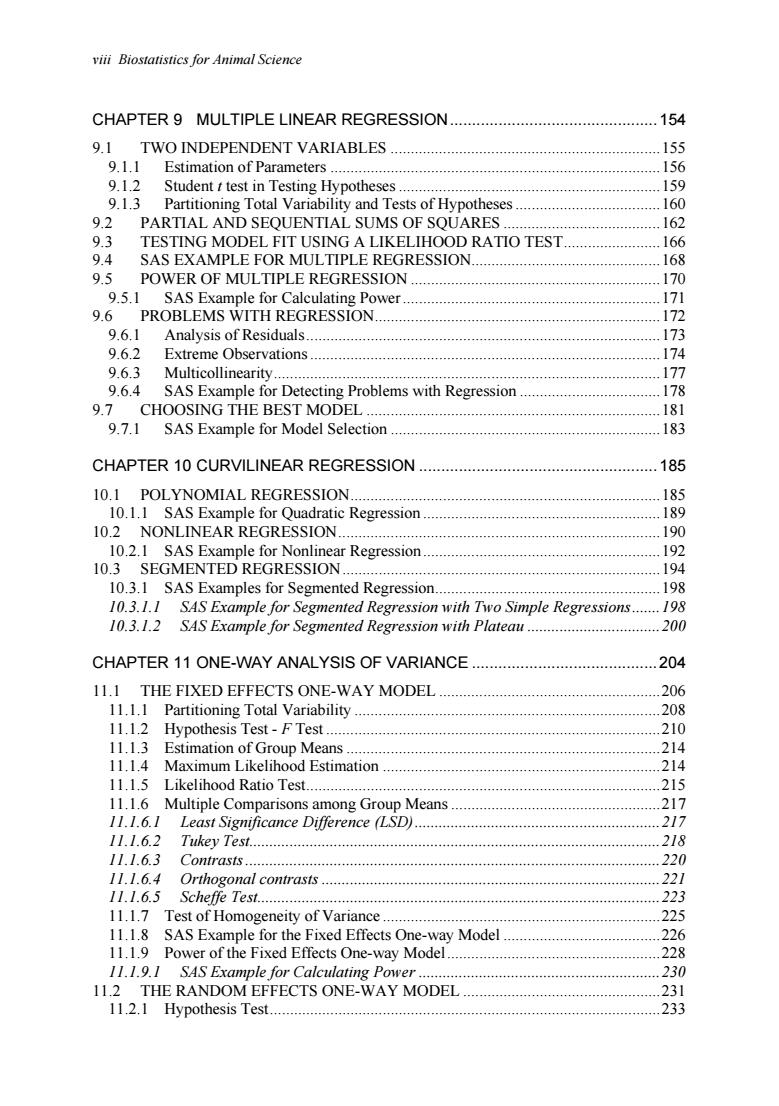
viii Biostatistics for Animal Science CHAPTER 9 MULTIPLE LINEAR REGRESSION.154 9.1 TWO INDEPENDENT VARIABLES .155 9.1.1 Estimation of Parameters .156 9.1.2 Student t test in Testing Hypotheses .159 9.1.3 Partitioning Total Variability and Tests of Hypotheses .160 9.2 PARTIAL AND SEQUENTIAL SUMS OF SQUARES .162 9.3 TESTING MODEL FIT USING A LIKELIHOOD RATIO TEST.166 9.4 SAS EXAMPLE FOR MULTIPLE REGRESSION.168 9.5 POWER OF MULTIPLE REGRESSION .170 9.5.1 SAS Example for Calculating Power .171 9.6 PROBLEMS WITH REGRESSION.172 9.6.1 Analysis of Residuals.173 9.6.2 Extreme Observations .174 9.6.3 Multicollinearity.177 9.6.4 SAS Example for Detecting Problems with Regression .178 9.7 CHOOSING THE BEST MODEL .181 9.7.1 SAS Example for Model Selection .183 CHAPTER 10 CURVILINEAR REGRESSION .185 10.1 POLYNOMIAL REGRESSION.185 10.1.1 SAS Example for Quadratic Regression .189 10.2 NONLINEAR REGRESSION.190 10.2.1 SAS Example for Nonlinear Regression.192 10.3 SEGMENTED REGRESSION.194 10.3.1 SAS Examples for Segmented Regression.198 10.3.1.1 SAS Example for Segmented Regression with Two Simple Regressions.198 10.3.1.2 SAS Example for Segmented Regression with Plateau .200 CHAPTER 11 ONE-WAY ANALYSIS OF VARIANCE .204 11.1 THE FIXED EFFECTS ONE-WAY MODEL .206 11.1.1 Partitioning Total Variability .208 11.1.2 Hypothesis Test - F Test .210 11.1.3 Estimation of Group Means .214 11.1.4 Maximum Likelihood Estimation .214 11.1.5 Likelihood Ratio Test.215 11.1.6 Multiple Comparisons among Group Means .217 11.1.6.1 Least Significance Difference (LSD).217 11.1.6.2 Tukey Test.218 11.1.6.3 Contrasts .220 11.1.6.4 Orthogonal contrasts .221 11.1.6.5 Scheffe Test.223 11.1.7 Test of Homogeneity of Variance .225 11.1.8 SAS Example for the Fixed Effects One-way Model .226 11.1.9 Power of the Fixed Effects One-way Model.228 11.1.9.1 SAS Example for Calculating Power .230 11.2 THE RANDOM EFFECTS ONE-WAY MODEL .231 11.2.1 Hypothesis Test.233

Contents ix Prediction of Group Means 234 Variance Component Estimation. 11.2.4 Intraclass Correlation Maximum Likelinood Es atio e icted Maximum kelihoo Estim 11.27 ation SA Example Io 11 the Random Effects One-way Mode MATRIX APPROACH TO THE ONE-WAY ANALYSIS OF VARIANCE 241 113 Fixed Effe 24 31 Model ar 13 Effect ModOne-way 251 114 MIXED MODELS 57 14 Rand 350 stimation 36 EXERCISES 262 CHAPTER 12 CONCEPTS OF EXPERIMENTAL DESIGN 263 121 EXPERIMENTAL UNITS AND REPLICATIONS 64 122 265 123 PRECISION OF EXPERIMENTAL DESIGN 266 24 ContrOLLING EXPERIMENTAL ERROR 36Q 12 REQUIRED NUMBER OF REPLICATIONS 26g 1051 for the Numbe 270 CHAPTER 13 BLOCKING. 272 13 1 RANDOMIZED COMPLETE BLOCK DESIGN 272 ing Total Variability 274 111 275 13.1.3 SAS Example for Block Desigr 279 13.2 RANDOMIZED BLOCK DESIGN -TWO OR MORE UNITS PER TREATMENT AND BLOCK 280 132 1 Partitio ing Total Variability and Test of Hypotheses 281 13.2.2 SAS Example for Two or More Experimental Unit per Block x Treatment.287 13.3 POWER OF TEST. )01 13.3.1 SAS Example for Calculating Power 291 EXERCISES. 293 CHAPTER 14 CHANGE-OVER DESIGNS. 294 14.1 SIMPLE CHANGE-OVER DESIGN 294 14.2 CHANGE-OVER DESIGNS WITH THE EFFECTS OF PERIODS. 297
Contents ix 11.2.2 Prediction of Group Means .234 11.2.3 Variance Component Estimation.235 11.2.4 Intraclass Correlation .237 11.2.5 Maximum Likelihood Estimation .238 11.2.6 Restricted Maximum Likelihood Estimation .240 11.2.7 SAS Example for the Random Effects One-way Model.241 11.3 MATRIX APPROACH TO THE ONE-WAY ANALYSIS OF VARIANCE MODEL .243 11.3.1 The Fixed Effects Model.243 11.3.1.1 Linear Model.243 11.3.1.2 Estimating Parameters.245 11.3.1.3 Maximum Likelihood Estimation .249 11.3.1.4 Regression Model for the One-way Analysis of Variance.250 11.3.2 The Random Effects Model .253 11.3.2.1 Linear Model.253 11.3.2.2 Prediction of Random Effects.254 11.3.2.3 Maximum Likelihood Estimation .256 11.3.2.4 Restricted Maximum Likelihood Estimation .257 11.4 MIXED MODELS .257 11.4.1.1 Prediction of Random Effects.258 11.4.1.2 Maximum Likelihood Estimation .259 11.4.1.3 Restricted Maximum Likelihood Estimation .260 EXERCISES .262 CHAPTER 12 CONCEPTS OF EXPERIMENTAL DESIGN.263 12.1 EXPERIMENTAL UNITS AND REPLICATIONS .264 12.2 EXPERIMENTAL ERROR.265 12.3 PRECISION OF EXPERIMENTAL DESIGN.266 12.4 CONTROLLING EXPERIMENTAL ERROR.268 12.5 REQUIRED NUMBER OF REPLICATIONS .269 12.5.1 SAS Example for the Number of Replications .270 CHAPTER 13 BLOCKING .272 13.1 RANDOMIZED COMPLETE BLOCK DESIGN.272 13.1.1 Partitioning Total Variability .274 13.1.2 Hypotheses Test - F test.275 13.1.3 SAS Example for Block Design.279 13.2 RANDOMIZED BLOCK DESIGN – TWO OR MORE UNITS PER TREATMENT AND BLOCK .280 13.2.1 Partitioning Total Variability and Test of Hypotheses.281 13.2.2 SAS Example for Two or More Experimental Unit per Block x Treatment.287 13.3 POWER OF TEST .291 13.3.1 SAS Example for Calculating Power .291 EXERCISES .293 CHAPTER 14 CHANGE-OVER DESIGNS.294 14.1 SIMPLE CHANGE-OVER DESIGN .294 14.2 CHANGE-OVER DESIGNS WITH THE EFFECTS OF PERIODS.297
x Biostatistics for Animal Science forChange-over Desnsh the Efts of eriodks Example for Latin Square 3 OVE AS SEVERAL LATIN SQUARES 0测 EXERCISES 31 CHAPTER 15 FACTORIAL EXPERIMENTS 313 152 EXERCISE 3 CHAPTER 16 HIERARCHICAL OR NESTED DESIGN 323 323 PLE FOR E CHAPTER 17 MORE ABOUT BLOCKING. 331 381 17.2 DOUBLE BLOCKING signs with Pens and Paddocks 338 CHAPTER 18 SPLIT-PLOT DESIGN 342 I8SPLIT-PLOT DESIGN -MAIN PLOTS IN RANDOMIZED BLOCKS 342 346 182 PLOT DESIGN- A COMPLETELY RANDOMIZED DE MAIN PLOTS INA 348 351 AS Example:Main Plots in a Completely Randomized Design 354 CHAPTER 19 ANALYSIS OF COVARIANCE. 355 for 19 TESTING THE DIFFERENCE BETWEEN REGRESSION SLOPES te 3 358 19.2.1 SAS Example for Testing the Difference between Regression Slopes .363 CHAPTER 20 REPEATED MEASURES 365 20.1 HOMOGENEOUS VARIANCES AND COVARIANCES AMONG REPEATED 65 20.11 SAS F ple for Homos s Va iances and covaria 36 20 HETEROGENEOUS VARIANCES AND COVARIANCES AMONG REPEATED 37 20.2.1SASE3 nples for Heteroc eneous Variances and Covariances. 373 203 RANDOM COEFFICIENT REGRESSION 76 20.3.1 SAS Ex 311 20.3.1.1Hom P rs ac ross Tr tments 277 20.3.12 e Po ments .379
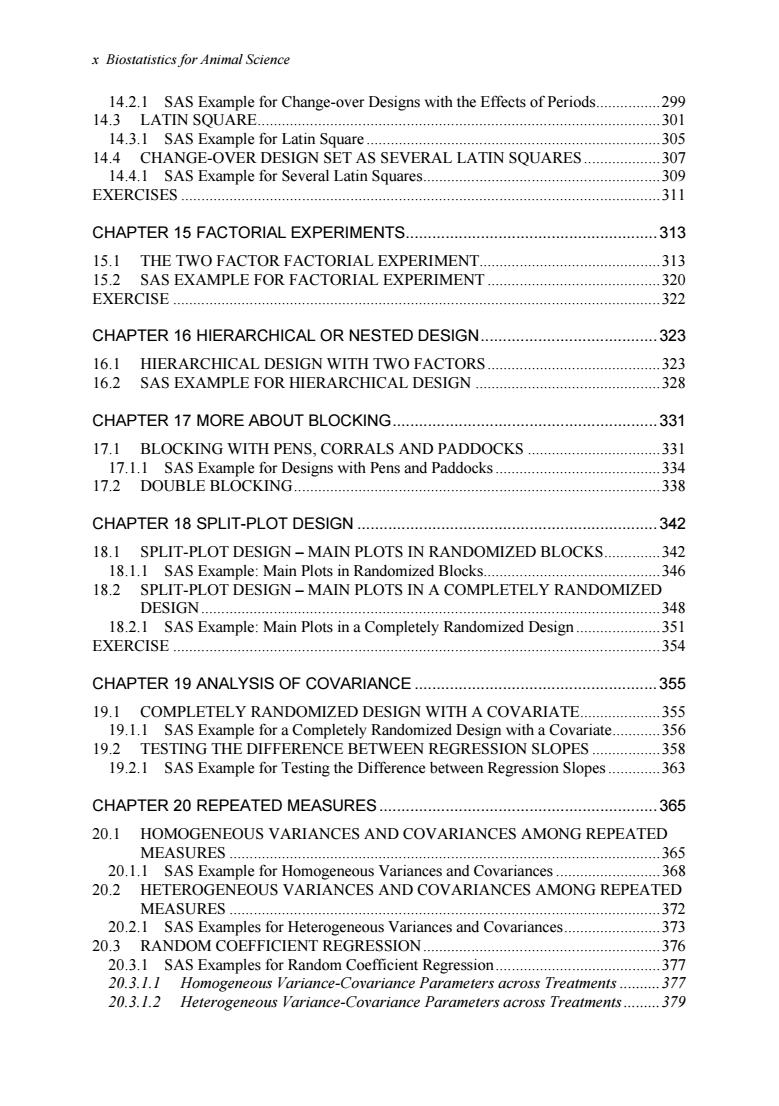
x Biostatistics for Animal Science 14.2.1 SAS Example for Change-over Designs with the Effects of Periods.299 14.3 LATIN SQUARE.301 14.3.1 SAS Example for Latin Square .305 14.4 CHANGE-OVER DESIGN SET AS SEVERAL LATIN SQUARES .307 14.4.1 SAS Example for Several Latin Squares.309 EXERCISES .311 CHAPTER 15 FACTORIAL EXPERIMENTS.313 15.1 THE TWO FACTOR FACTORIAL EXPERIMENT.313 15.2 SAS EXAMPLE FOR FACTORIAL EXPERIMENT .320 EXERCISE .322 CHAPTER 16 HIERARCHICAL OR NESTED DESIGN.323 16.1 HIERARCHICAL DESIGN WITH TWO FACTORS.323 16.2 SAS EXAMPLE FOR HIERARCHICAL DESIGN .328 CHAPTER 17 MORE ABOUT BLOCKING.331 17.1 BLOCKING WITH PENS, CORRALS AND PADDOCKS .331 17.1.1 SAS Example for Designs with Pens and Paddocks .334 17.2 DOUBLE BLOCKING.338 CHAPTER 18 SPLIT-PLOT DESIGN .342 18.1 SPLIT-PLOT DESIGN – MAIN PLOTS IN RANDOMIZED BLOCKS.342 18.1.1 SAS Example: Main Plots in Randomized Blocks.346 18.2 SPLIT-PLOT DESIGN – MAIN PLOTS IN A COMPLETELY RANDOMIZED DESIGN.348 18.2.1 SAS Example: Main Plots in a Completely Randomized Design .351 EXERCISE .354 CHAPTER 19 ANALYSIS OF COVARIANCE .355 19.1 COMPLETELY RANDOMIZED DESIGN WITH A COVARIATE.355 19.1.1 SAS Example for a Completely Randomized Design with a Covariate.356 19.2 TESTING THE DIFFERENCE BETWEEN REGRESSION SLOPES .358 19.2.1 SAS Example for Testing the Difference between Regression Slopes .363 CHAPTER 20 REPEATED MEASURES .365 20.1 HOMOGENEOUS VARIANCES AND COVARIANCES AMONG REPEATED MEASURES .365 20.1.1 SAS Example for Homogeneous Variances and Covariances .368 20.2 HETEROGENEOUS VARIANCES AND COVARIANCES AMONG REPEATED MEASURES .372 20.2.1 SAS Examples for Heterogeneous Variances and Covariances.373 20.3 RANDOM COEFFICIENT REGRESSION.376 20.3.1 SAS Examples for Random Coefficient Regression.377 20.3.1.1 Homogeneous Variance-Covariance Parameters across Treatments .377 20.3.1.2 Heterogeneous Variance-Covariance Parameters across Treatments .379
Contents xi CHAPTER 21 ANALYSIS OF NUMERICAL TREATMENT LEVELS. .384 21.1 LACK OF FIT. 384 21.1.1 SAS Example for Lack of Fit. .387 21.2 POLYNOMIAL ORTHOGONAL CONTRASTS 389 21.2.1 SAS Example for Polynomial Contrasts. 391 CHAPTER 22 DISCRETE DEPENDENT VARIABLES 394 22.1 LOGIT MODELS,LOGISTIC REGRESSION. 395 22.1.1 Testing Hypotheses. .397 22.1.2 SAS Examples for Logistic Models. 402 22.2 PROBIT MODEL. .407 22.2.1 SAS Example for a Probit model. .409 22.3 LOG-LINEAR MODELS. .412 22.3.1 SAS Example for a Log-Linear Model. .415 SOLUTIONS OF EXERCISES 419 APPENDIX A:VECTORS AND MATRICES. 421 TYPES AND PROPERTIES OF MATRICES. 421 MATRIX AND VECTOR OPERATIONS. .422 APPENDIX B:STATISTICAL TABLES. 426 AREA UNDER THE STANDARD NORMAL CURVE,Z>Z 426 CRITICAL VALUES OF STUDENT TDISTRIBUTIONS,T>T 427 CRITICAL VALUES OF CHI-SQUARE DISTRIBUTIONS.> 420 CRITICAL VALUES OF F DISTRIBUTIONS,F>F =00 431 OF 0.01 UE STUDEN ZED RANGE.(4,V) REFERENCES 436 SUBJECT INDEX 439
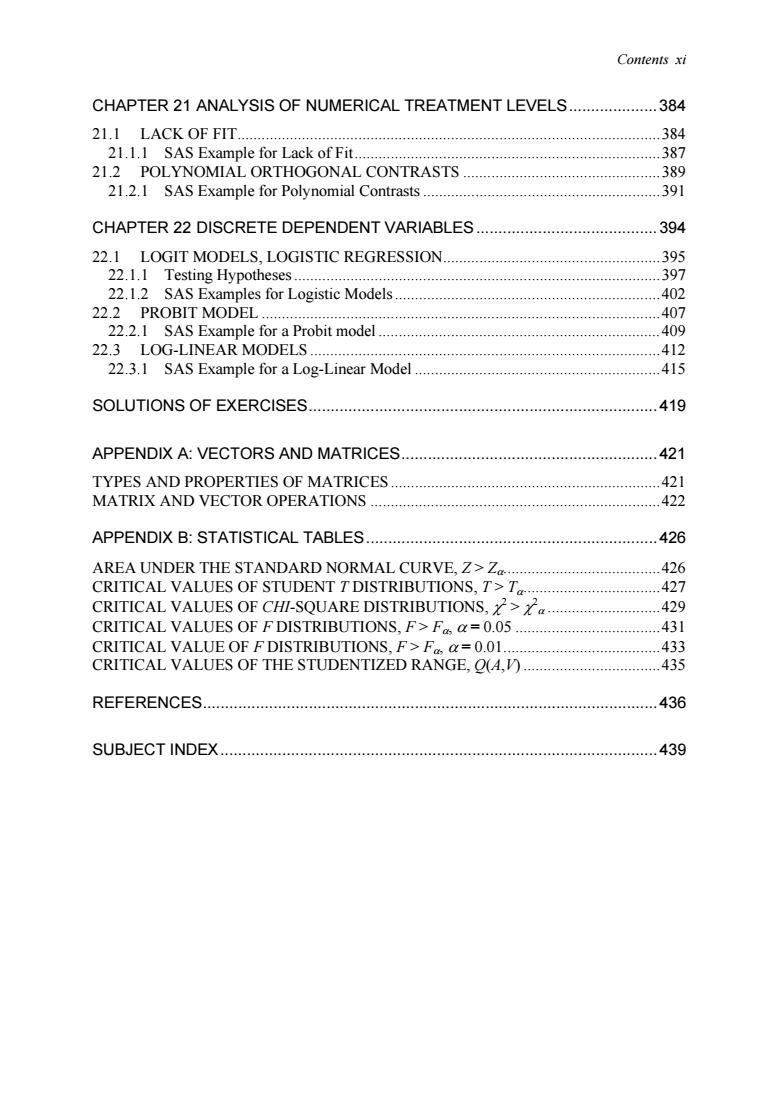
Contents xi CHAPTER 21 ANALYSIS OF NUMERICAL TREATMENT LEVELS.384 21.1 LACK OF FIT.384 21.1.1 SAS Example for Lack of Fit.387 21.2 POLYNOMIAL ORTHOGONAL CONTRASTS .389 21.2.1 SAS Example for Polynomial Contrasts .391 CHAPTER 22 DISCRETE DEPENDENT VARIABLES .394 22.1 LOGIT MODELS, LOGISTIC REGRESSION.395 22.1.1 Testing Hypotheses .397 22.1.2 SAS Examples for Logistic Models .402 22.2 PROBIT MODEL .407 22.2.1 SAS Example for a Probit model .409 22.3 LOG-LINEAR MODELS .412 22.3.1 SAS Example for a Log-Linear Model .415 SOLUTIONS OF EXERCISES.419 APPENDIX A: VECTORS AND MATRICES.421 TYPES AND PROPERTIES OF MATRICES .421 MATRIX AND VECTOR OPERATIONS .422 APPENDIX B: STATISTICAL TABLES.426 AREA UNDER THE STANDARD NORMAL CURVE, Z > Zα.426 CRITICAL VALUES OF STUDENT T DISTRIBUTIONS, T > Tα.427 CRITICAL VALUES OF CHI-SQUARE DISTRIBUTIONS, χ 2 > χ 2 α .429 CRITICAL VALUES OF F DISTRIBUTIONS, F > Fα, α = 0.05 .431 CRITICAL VALUE OF F DISTRIBUTIONS, F > Fα, α = 0.01.433 CRITICAL VALUES OF THE STUDENTIZED RANGE, Q(A,V) .435 REFERENCES.436 SUBJECT INDEX.439
Preface This book was written to serve students and researchers of the animal sciences with the opriate experimental designs dsisca todsistia methodsrkow biostatistics or biometrics.and they have their origins in agricultural research.The characteristic that distinguishes biometrics within statistics is the fact that biological are variable,not only because of measurement error.but also from their natural variability from genetic and environmental sources.These sources of variability must be taken into account when making inferences about biological material.Accounting for these sources of variation has led to the development of experimental designs that incorporate blocking covariates and repeated measures.Appropriate techniques for analysis of data from these designs and others are covered in the book. Early in the book,readers are presented basic principles of statistics so they will be able to follow subsequent applications with familiarity and understanding.and without having to switch to another book of introductory statistics.Later chapters cover statistical methods most frequently used in the animal sciences for analysis of continuous and categorical variables.Each chapter begins by introducing a problem with practical questions,followed with a brief theoretical background and short proofs.The text is augmented with examples,mostly from animal sciences and related fields,with the purpose of making applications of the statistical methods familiar.Some examples are very simple and are presented in order to provide basic understanding and the logic behind calculations. These examples can be solved using a pocket calculator.Some examples are more complex. especially those in the later chapters.Most examples are also solved using SAS statistical software.Both sample SAS programs and SAS listings are given with brief explanations Further,the solutions are often given with sufficient decimal digits,more than is practically necessary,so that readers can compare results to verify calculation technique. The first five chapters of the book are:1)Presenting and Summarizing Data;2) Probability;3)Random Variables and Their Distributions;4)Population and Sample;and 5)Estimation of Parameters.These chapters provide a basic introduction to biostatistics including definitions of terms,coverage of descriptive statistics and graphical presentation of data,the basic rules of probability,methods of parameter estimation,and descriptions of distributions including the Bernoulli,binomial,hypergeometric,Poisson,multinomial, uniform,normal,chi-square,1,and F distributions.Chapter 6 describes hypothesis testing and includes explanations of the null and alternate hypotheses,use of probability or density functions,critical values,critical region and P values.Hypothesis tests for many specific cases are shown such as population means and proportions,expected and empirical frequency,and test of variances.Also,the use of confidence intervals in hypothesis testing is shown.The difference between statistical and practical significance,types of errors in making conclusions,power of test,and sample size are discussed. Chapters 7 to 10 present the topics of correlation and regression.The coverage begins with simple linear regression and describes the model,its parameters and assumptions. Least squares and maximum likelihood methods of parameter estimation are shown.The concept of partitioning the total variance to explained and unexplained sources in the analysis of variance table is introduced.In chapter 8 the general meaning and definition of 和
xii Preface This book was written to serve students and researchers of the animal sciences, with the primary purpose of helping them to learn about and apply appropriate experimental designs and statistical methods. Statistical methods applied to biological sciences are known as biostatistics or biometrics, and they have their origins in agricultural research. The characteristic that distinguishes biometrics within statistics is the fact that biological measurements are variable, not only because of measurement error, but also from their natural variability from genetic and environmental sources. These sources of variability must be taken into account when making inferences about biological material. Accounting for these sources of variation has led to the development of experimental designs that incorporate blocking, covariates and repeated measures. Appropriate techniques for analysis of data from these designs and others are covered in the book. Early in the book, readers are presented basic principles of statistics so they will be able to follow subsequent applications with familiarity and understanding, and without having to switch to another book of introductory statistics. Later chapters cover statistical methods most frequently used in the animal sciences for analysis of continuous and categorical variables. Each chapter begins by introducing a problem with practical questions, followed with a brief theoretical background and short proofs. The text is augmented with examples, mostly from animal sciences and related fields, with the purpose of making applications of the statistical methods familiar. Some examples are very simple and are presented in order to provide basic understanding and the logic behind calculations. These examples can be solved using a pocket calculator. Some examples are more complex, especially those in the later chapters. Most examples are also solved using SAS statistical software. Both sample SAS programs and SAS listings are given with brief explanations. Further, the solutions are often given with sufficient decimal digits, more than is practically necessary, so that readers can compare results to verify calculation technique. The first five chapters of the book are: 1) Presenting and Summarizing Data; 2) Probability; 3) Random Variables and Their Distributions; 4) Population and Sample; and 5) Estimation of Parameters. These chapters provide a basic introduction to biostatistics including definitions of terms, coverage of descriptive statistics and graphical presentation of data, the basic rules of probability, methods of parameter estimation, and descriptions of distributions including the Bernoulli, binomial, hypergeometric, Poisson, multinomial, uniform, normal, chi-square, t, and F distributions. Chapter 6 describes hypothesis testing and includes explanations of the null and alternate hypotheses, use of probability or density functions, critical values, critical region and P values. Hypothesis tests for many specific cases are shown such as population means and proportions, expected and empirical frequency, and test of variances. Also, the use of confidence intervals in hypothesis testing is shown. The difference between statistical and practical significance, types of errors in making conclusions, power of test, and sample size are discussed. Chapters 7 to 10 present the topics of correlation and regression. The coverage begins with simple linear regression and describes the model, its parameters and assumptions. Least squares and maximum likelihood methods of parameter estimation are shown. The concept of partitioning the total variance to explained and unexplained sources in the analysis of variance table is introduced. In chapter 8 the general meaning and definition of
Preface xiii the correlation coeficient.and the estimation of the correlticeient from samples and testing of hypothesis are shown.In chapters and and curvilinea regressions are described.Important facts are explained using matrices n same order of argument as for the simple regression. M part sequent of squares,test quacy using a function,and Conceptual Akaike criteria Some common regres n analysis like outliers an multicolline arity are described,and thei n ar are including estimat and segmente ing growth curves and fur s for dete chapte apter a one- analysi omp incl e 3 e Ch s 12 to 21 de the yse Spe 0n g plots. e repe merical treat Examples h sample SAS programs are provi r eac The final c odels apter the special top e of dis ables dependent variables ogit and are explaine A is given with examples and SAS proce vish to e who helned us oduce this hook We extend ou e Keisler.Hen and Vesna Luzar-Stmer for .Kris reviews,and Cyndi Cind Hudlow an nd Dragan Tupajic for their assistance with editing Zagreb croatia Columbia.Missouri William R.Lamberson March 2004
Preface xiii the correlation coefficient, and the estimation of the correlation coefficient from samples and testing of hypothesis are shown. In chapters 9 and 10 multiple and curvilinear regressions are described. Important facts are explained using matrices in the same order of argument as for the simple regression. Model building is introduced including the definitions of partial and sequential sum of squares, test of model adequacy using a likelihood function, and Conceptual Predictive and Akaike criteria. Some common problems of regression analysis like outliers and multicollinearity are described, and their detection and possible remedies are explained. Polynomial, nonlinear and segmented regressions are introduced. Some examples are shown including estimating growth curves and functions with a plateau such as for determining nutrient requirements. One-way analysis of variance is introduced in chapter 11. In this chapter a one-way analysis of variance model is used to define hypotheses, partition sums of squares in order to use an F test, and estimate means and effects. Post-test comparison of means, including least significant difference, Tukey test and contrasts are shown. Fixed and random effects models are compared, and fixed and random effects are also shown using matrices. Chapters 12 to 21 focus on specific experimental designs and their analyses. Specific topics include: general concepts of design, blocking, change-over designs, factorials, nested designs, double blocking, split-plots, analysis of covariance, repeated measures and analysis of numerical treatment levels. Examples with sample SAS programs are provided for each topic. The final chapter covers the special topic of discrete dependent variables. Logit and probit models for binary and binomial dependent variables and loglinear models for count data are explained. A brief theoretical background is given with examples and SAS procedures. We wish to express our gratitude to everyone who helped us produce this book. We extend our special acknowledgement to Matt Lucy, Duane Keisler, Henry Mesa, Kristi Cammack, Marijan Posavi and Vesna Luzar-Stiffler for their reviews, and Cyndi Jennings, Cinda Hudlow and Dragan Tupajic for their assistance with editing. Zagreb, Croatia Miroslav Kaps Columbia, Missouri William R. Lamberson March 2004